Stories

Stories

Every story on the dashboard, newest first — each written from the measurement, each with the tool that produces its answer. Read them without an account; the tools need one.

A work-from-home grade for every district, the way a walk score grades a street
Jul 2026

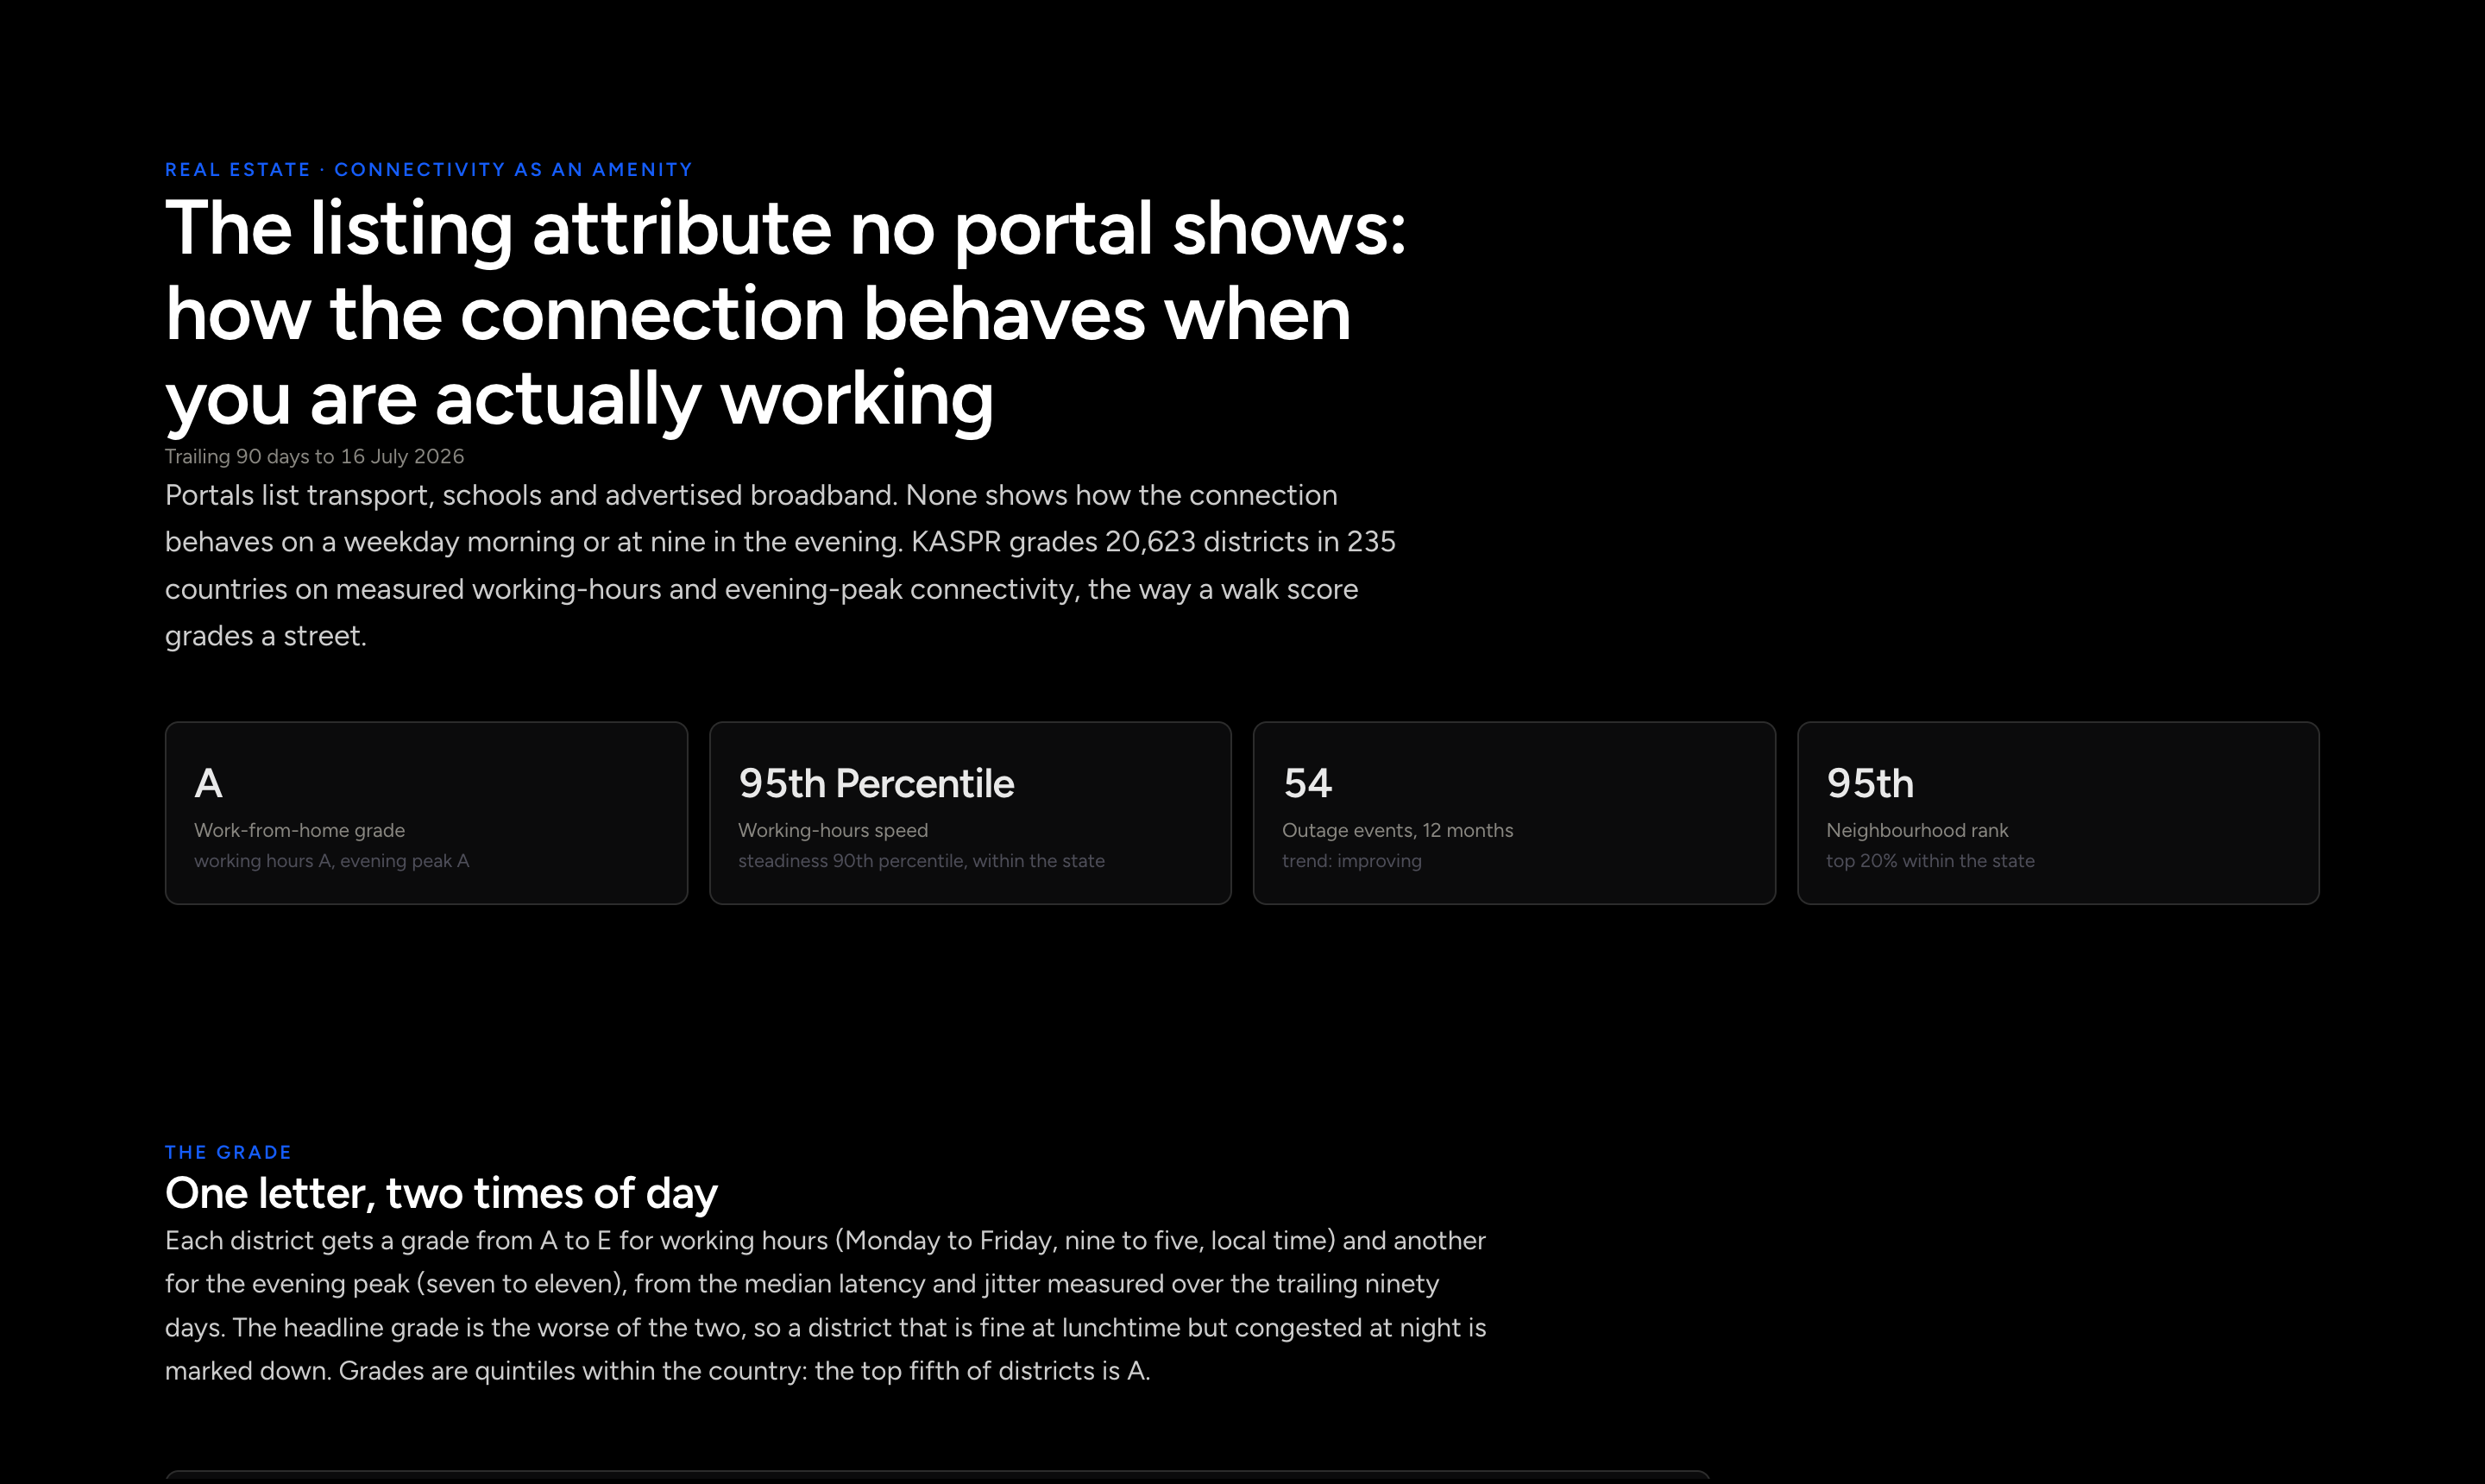
A work-from-home grade for every district, the way a walk score grades a street

20,623 districts graded on measured working-hours and evening connectivity; 7% of Australian districts earn an A.

Signal · Measured, not advertised, and split by time of day.

Action · Open the Atlas and compare two suburbs’ typical working day.
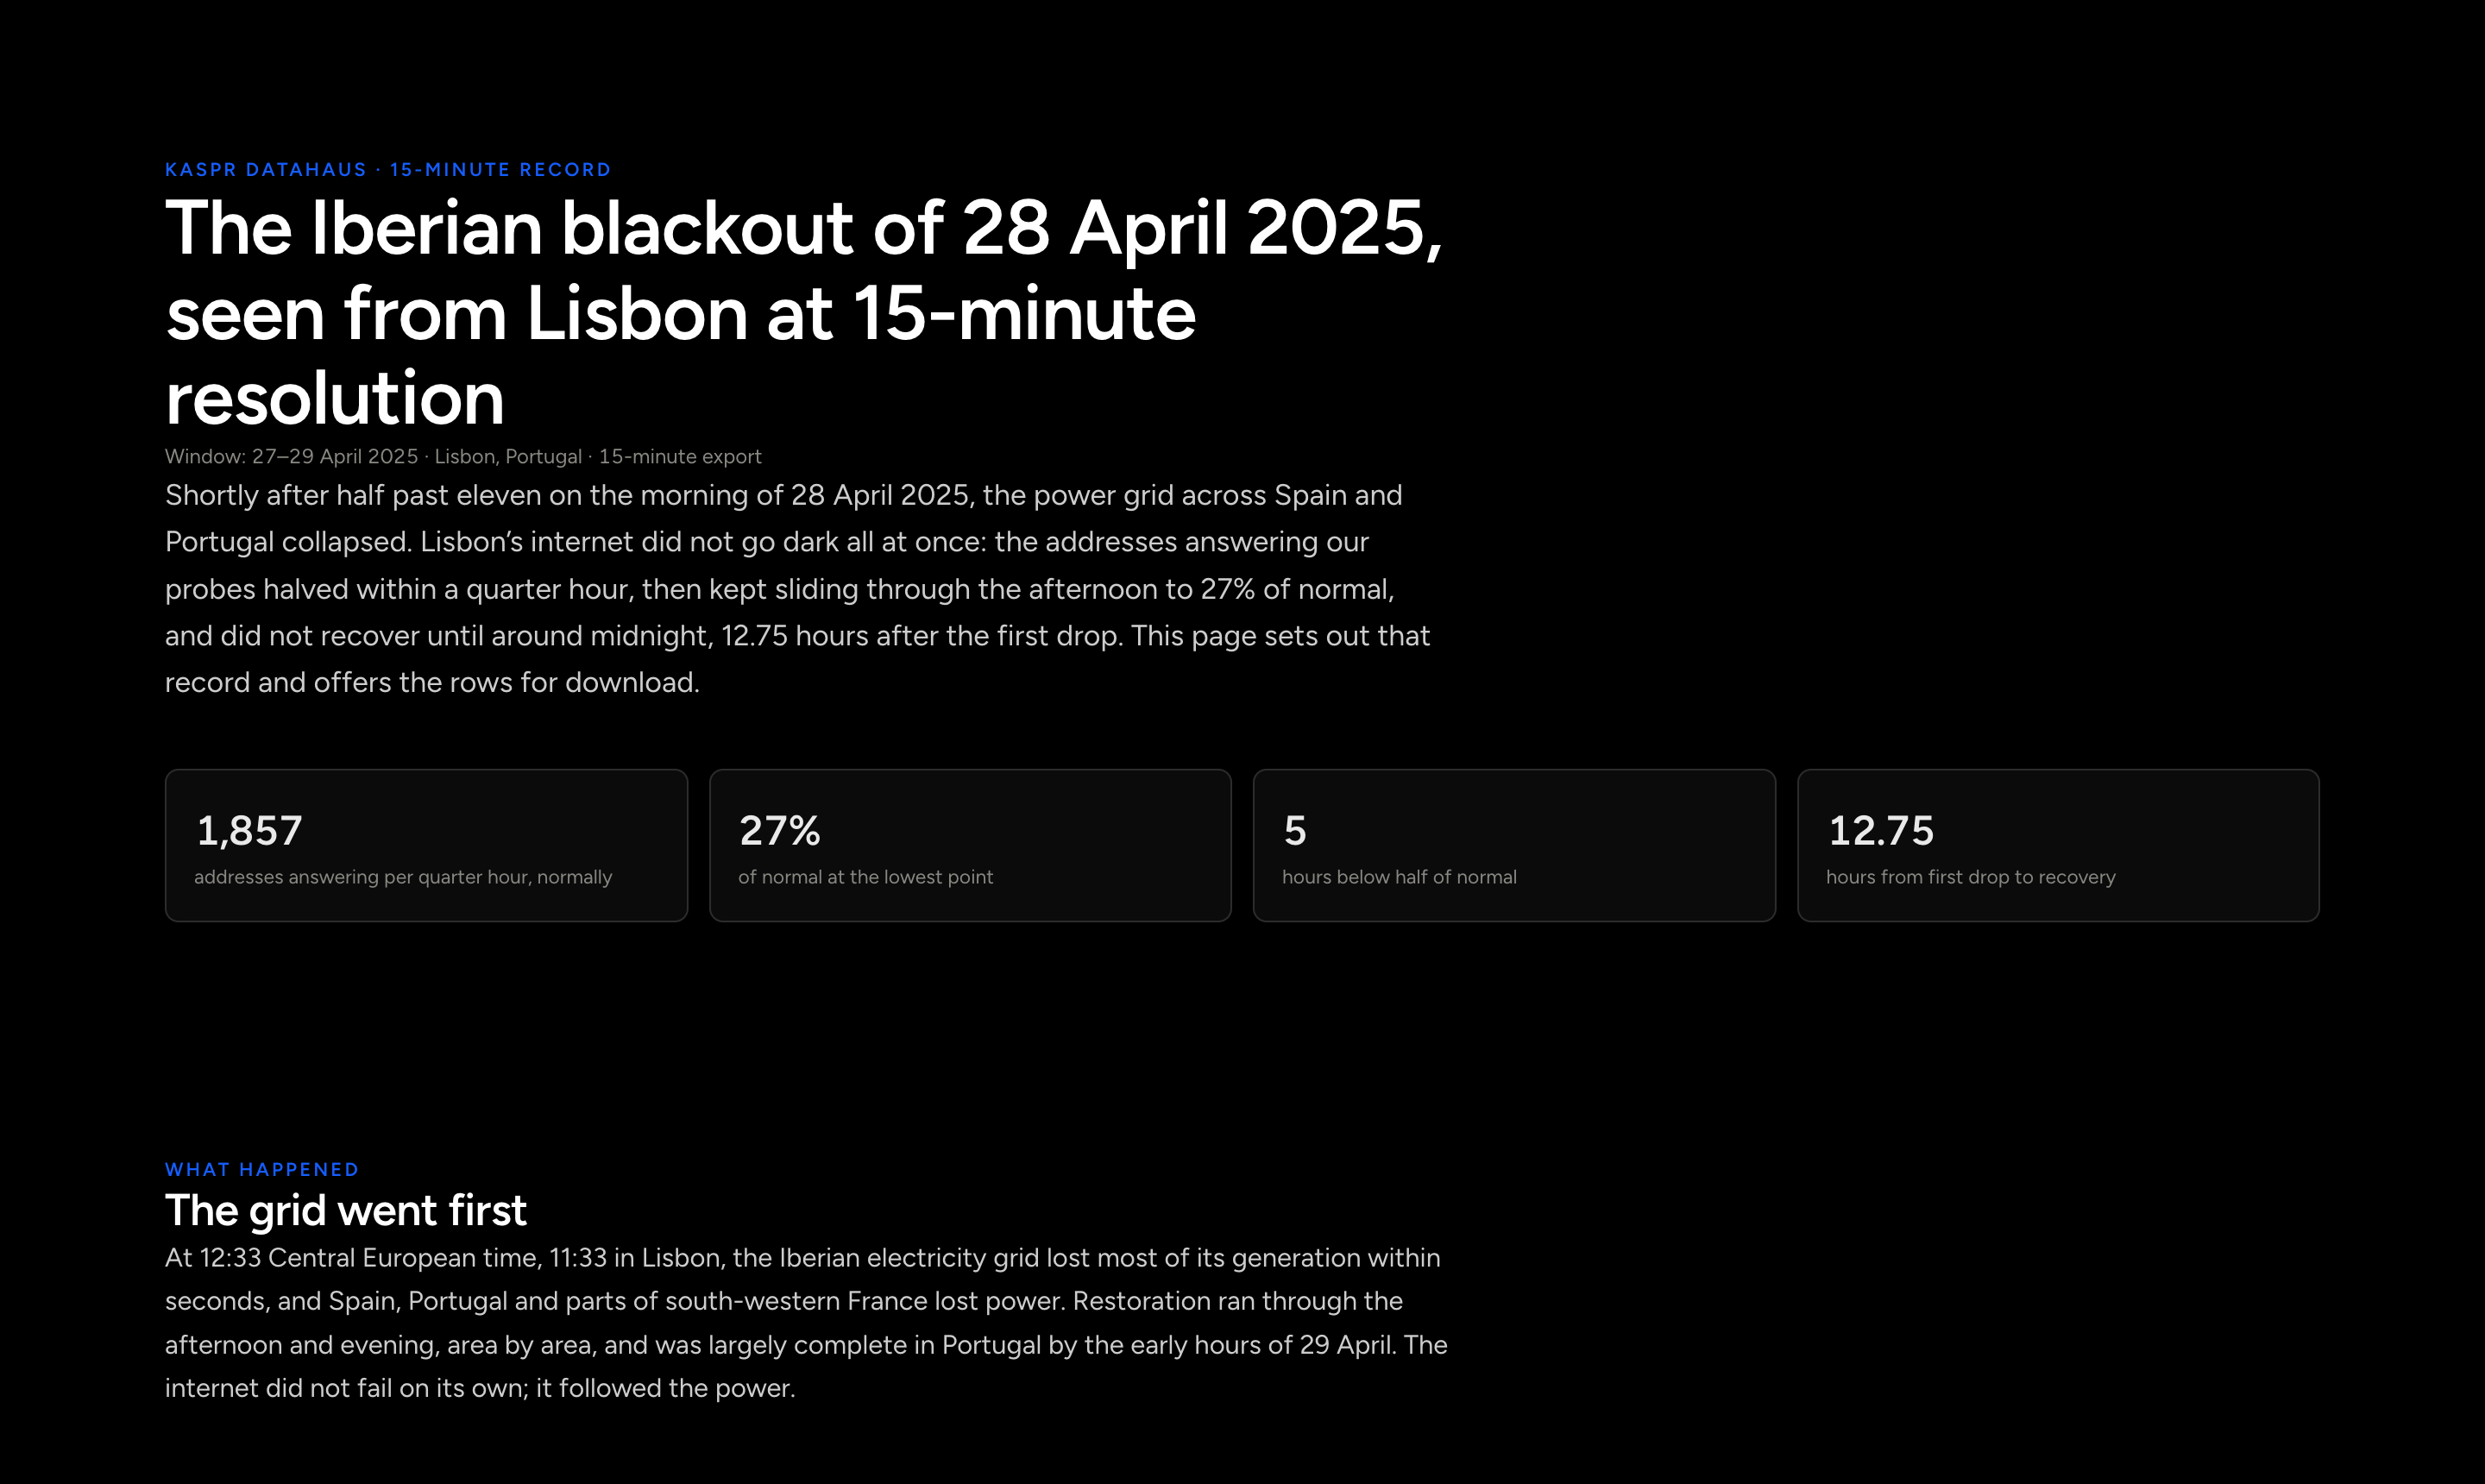
The Iberian blackout of 28 April 2025, as Lisbon’s internet saw it
Apr 2025

The Iberian blackout of 28 April 2025, as Lisbon’s internet saw it

When the grid collapsed, the addresses answering in Lisbon halved within a quarter hour, then kept sliding through the afternoon to about a quarter of normal by early evening. Recovery took until around midnight, some thirteen hours in all, with the rows to download.

Signal · power loss and internet loss on one clock

Action · watch any district at 15-minute resolution

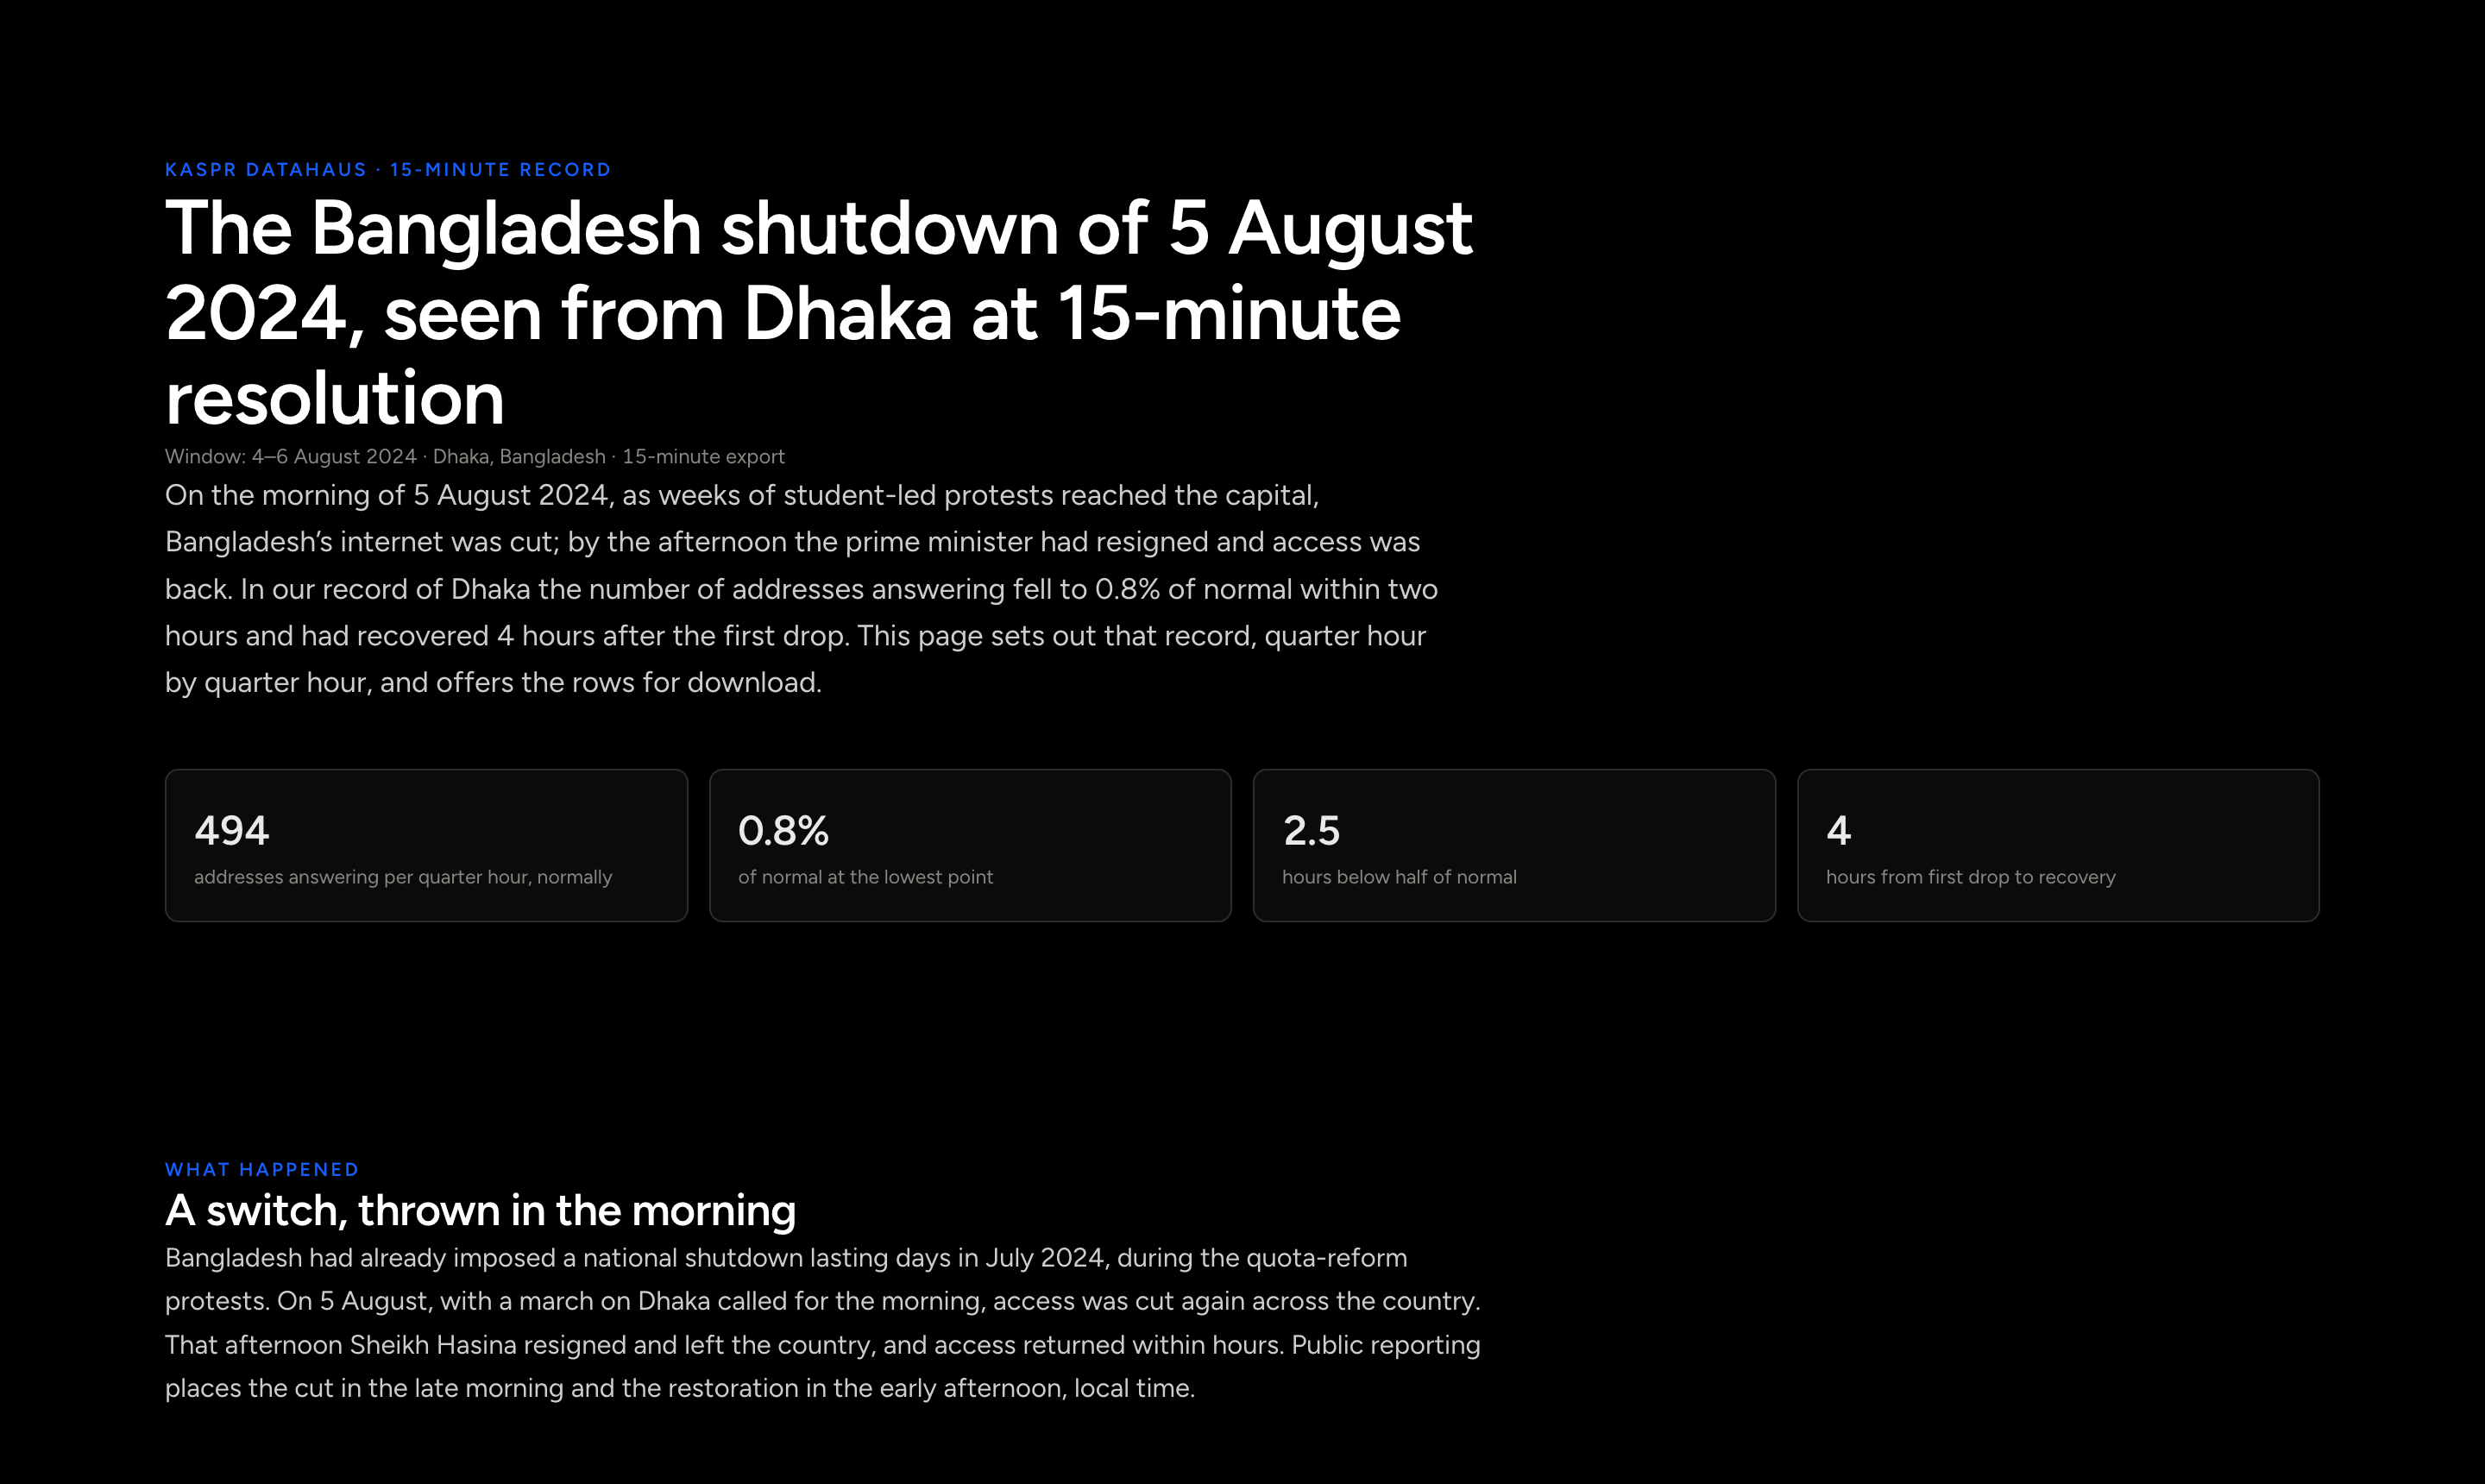
The Bangladesh internet shutdown of 5 August 2024, at 15-minute resolution
Aug 2024

The Bangladesh internet shutdown of 5 August 2024, at 15-minute resolution

In Dhaka the number of addresses answering our probes fell from about 500 to 4 within two hours of the morning cut, stayed there for most of two hours, and was back to normal by mid-afternoon: four hours end to end, with the rows to download.

Signal · a shutdown’s timing to the quarter hour, from outside the country

Action · follow any district at 15-minute resolution

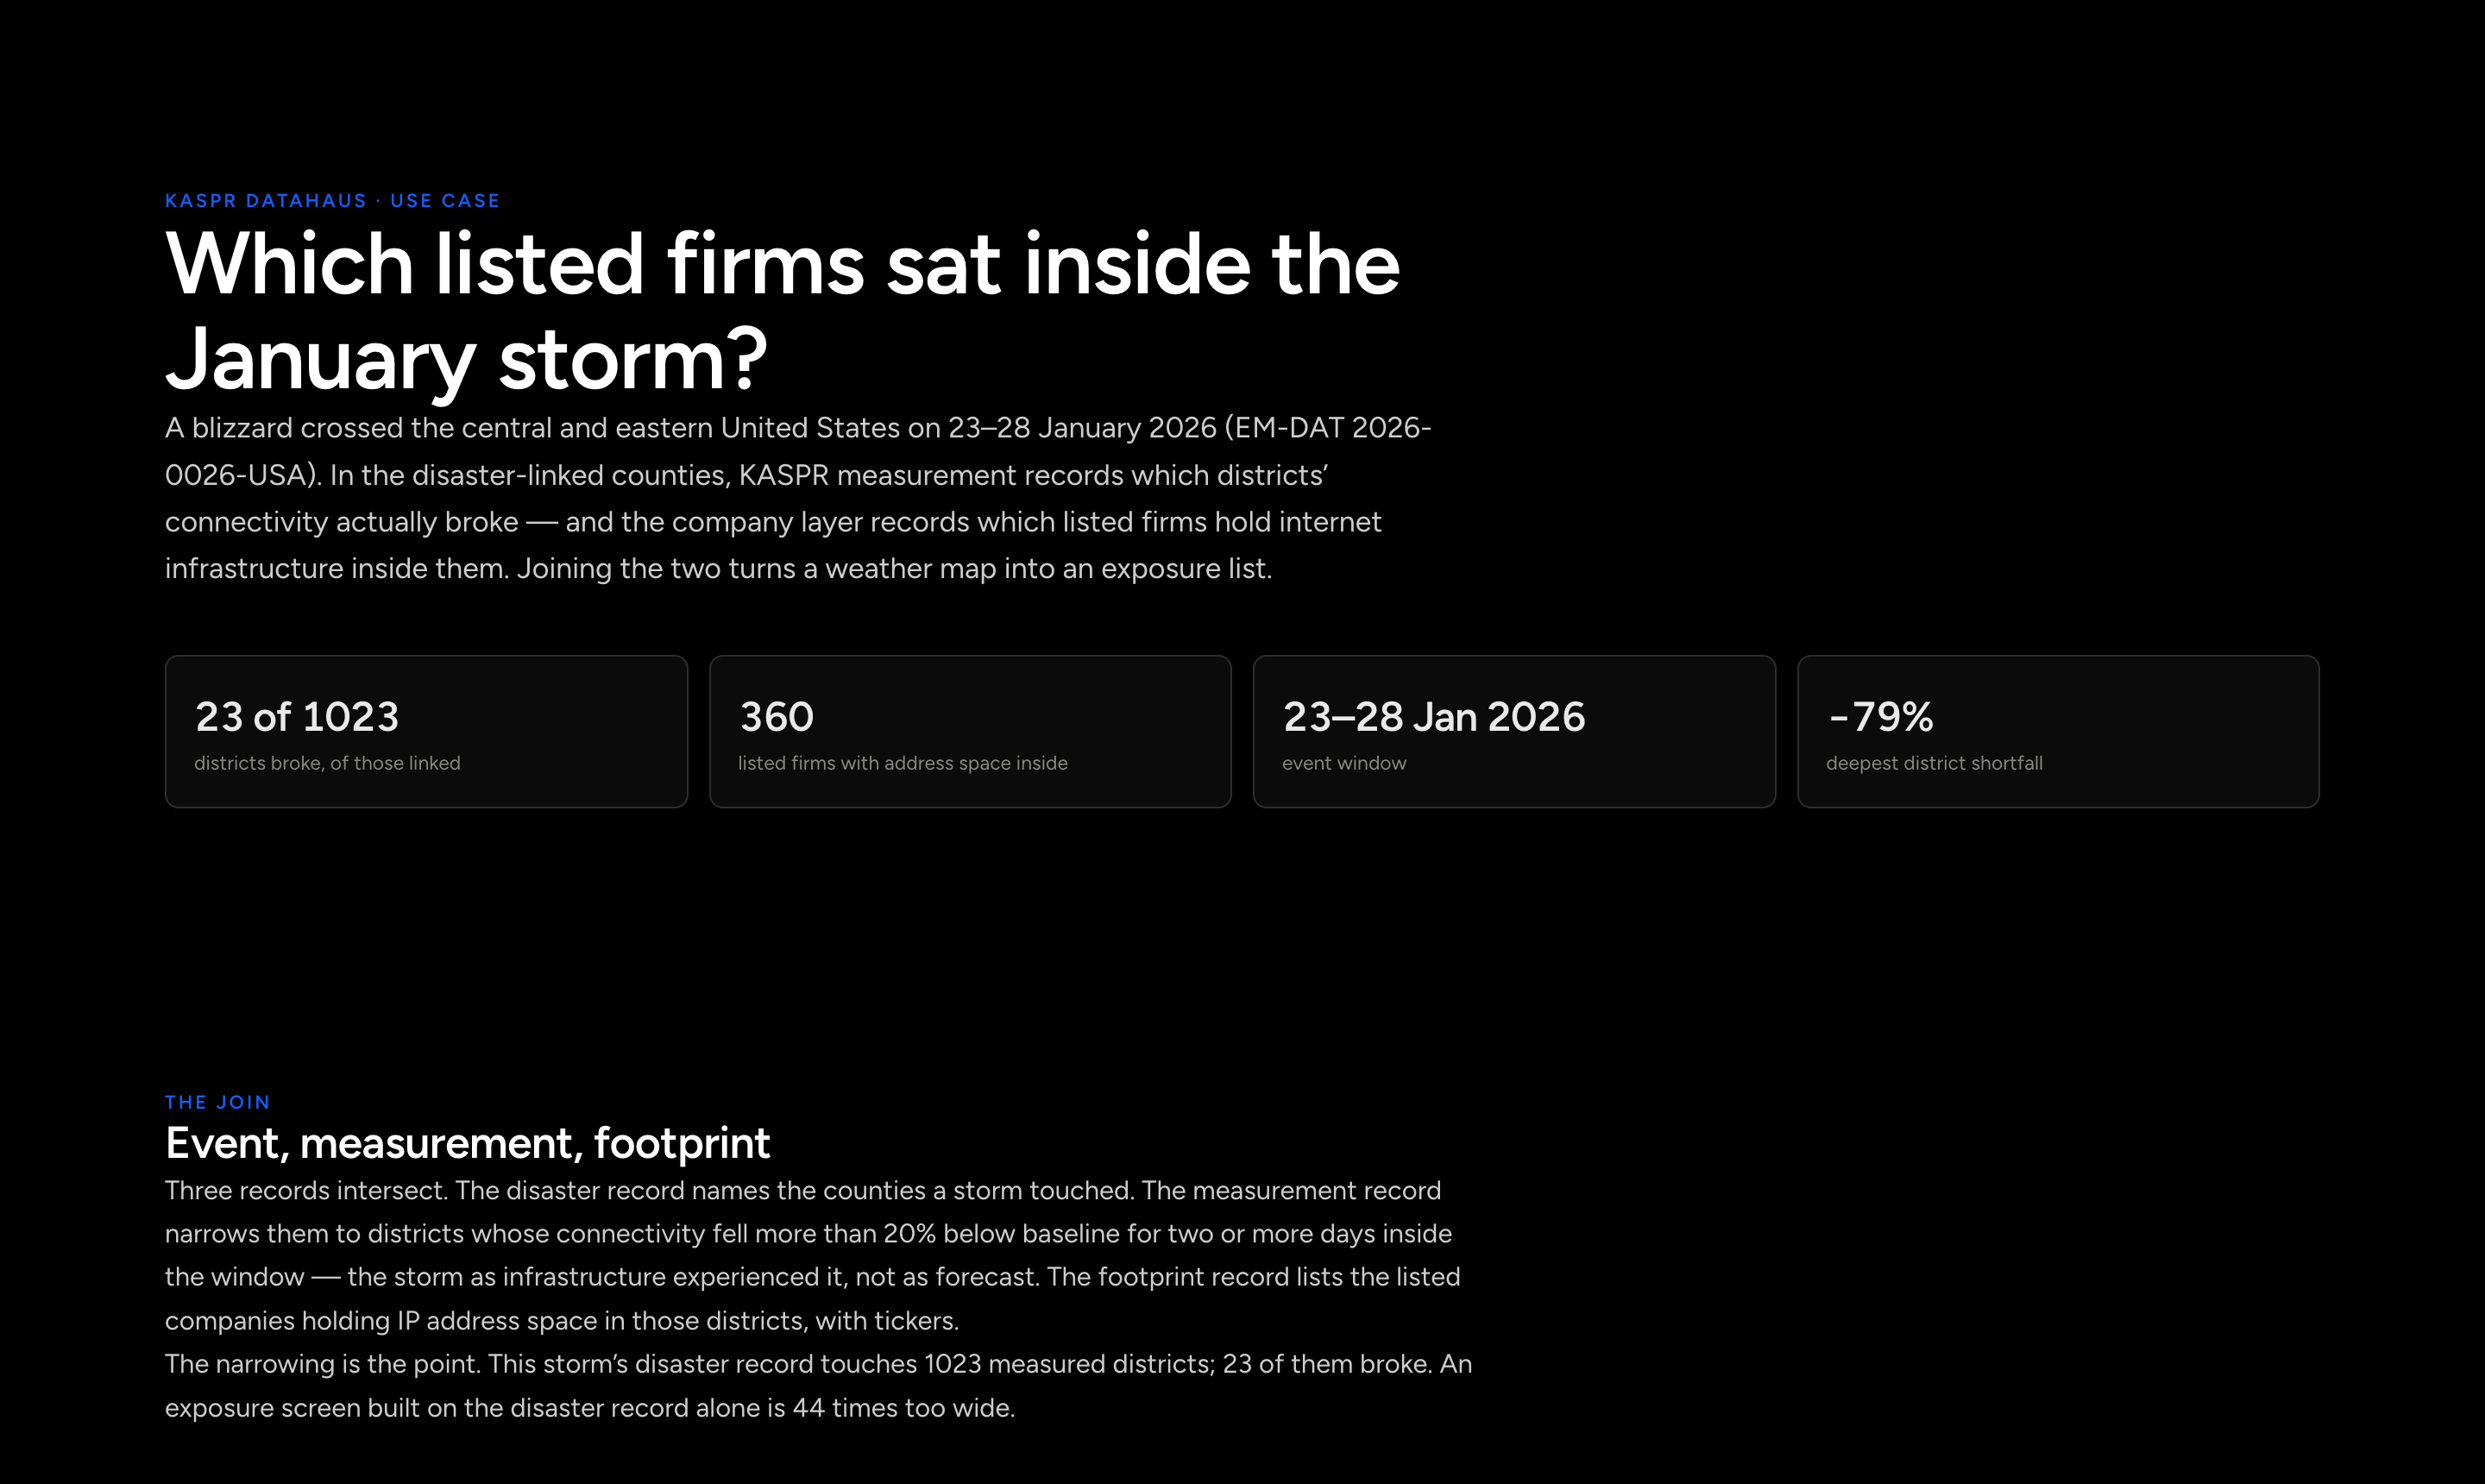
Which listed firms had infrastructure in the districts a blizzard broke
Jan 2026

Which listed firms had infrastructure in the districts a blizzard broke

The disaster record said the January 2026 blizzard touched 1,023 measured US districts. Our measurement found only 23 of them actually lost connectivity. Inside those 23 sat infrastructure belonging to 360 listed companies, AT&T to Amazon, and the list existed days before any damage was reported.

Signal · an exposure list, days before damage reporting

Action · screen any event against your own footprint

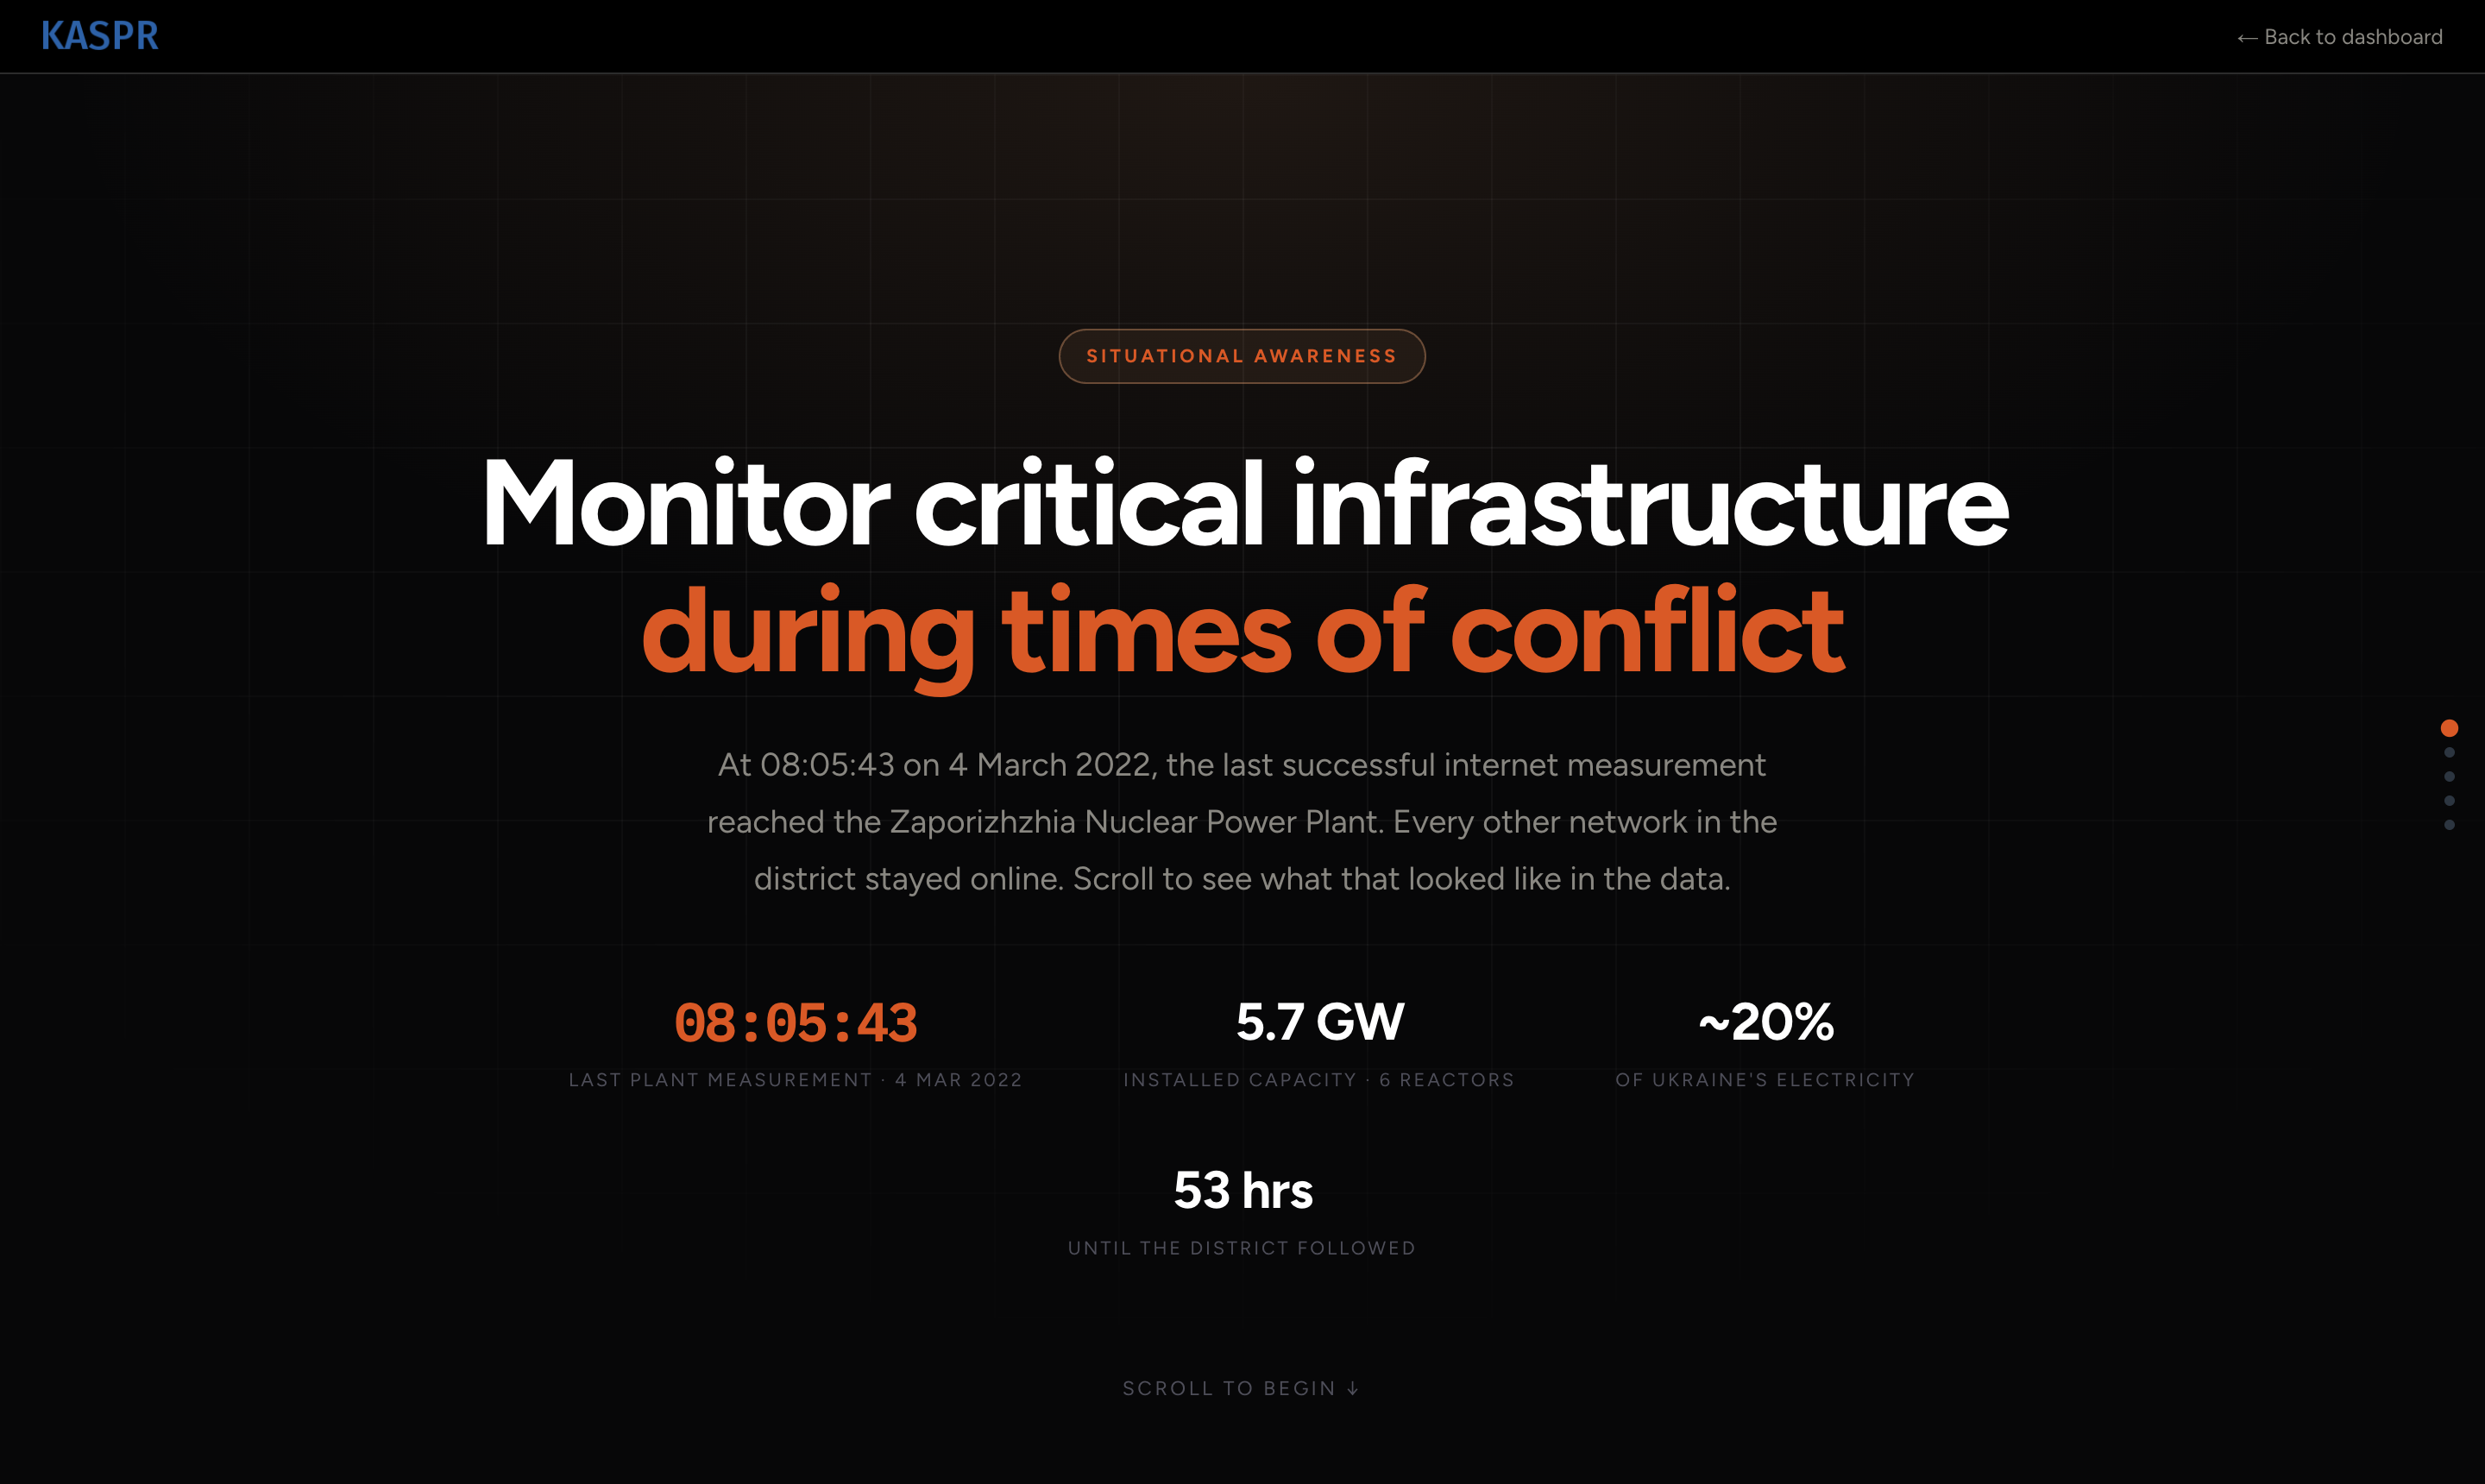
Monitoring the Zaporizhzhia nuclear plant through the war, from open measurement
Mar 2022

Monitoring the Zaporizhzhia nuclear plant through the war, from open measurement

In March 2022 the plant went offline while the district around it stayed connected. The measurement record separated the facility from its surroundings in near-real time, without anyone on the ground.

Signal · asset-level situational awareness

Action · monitor the assets you are responsible for

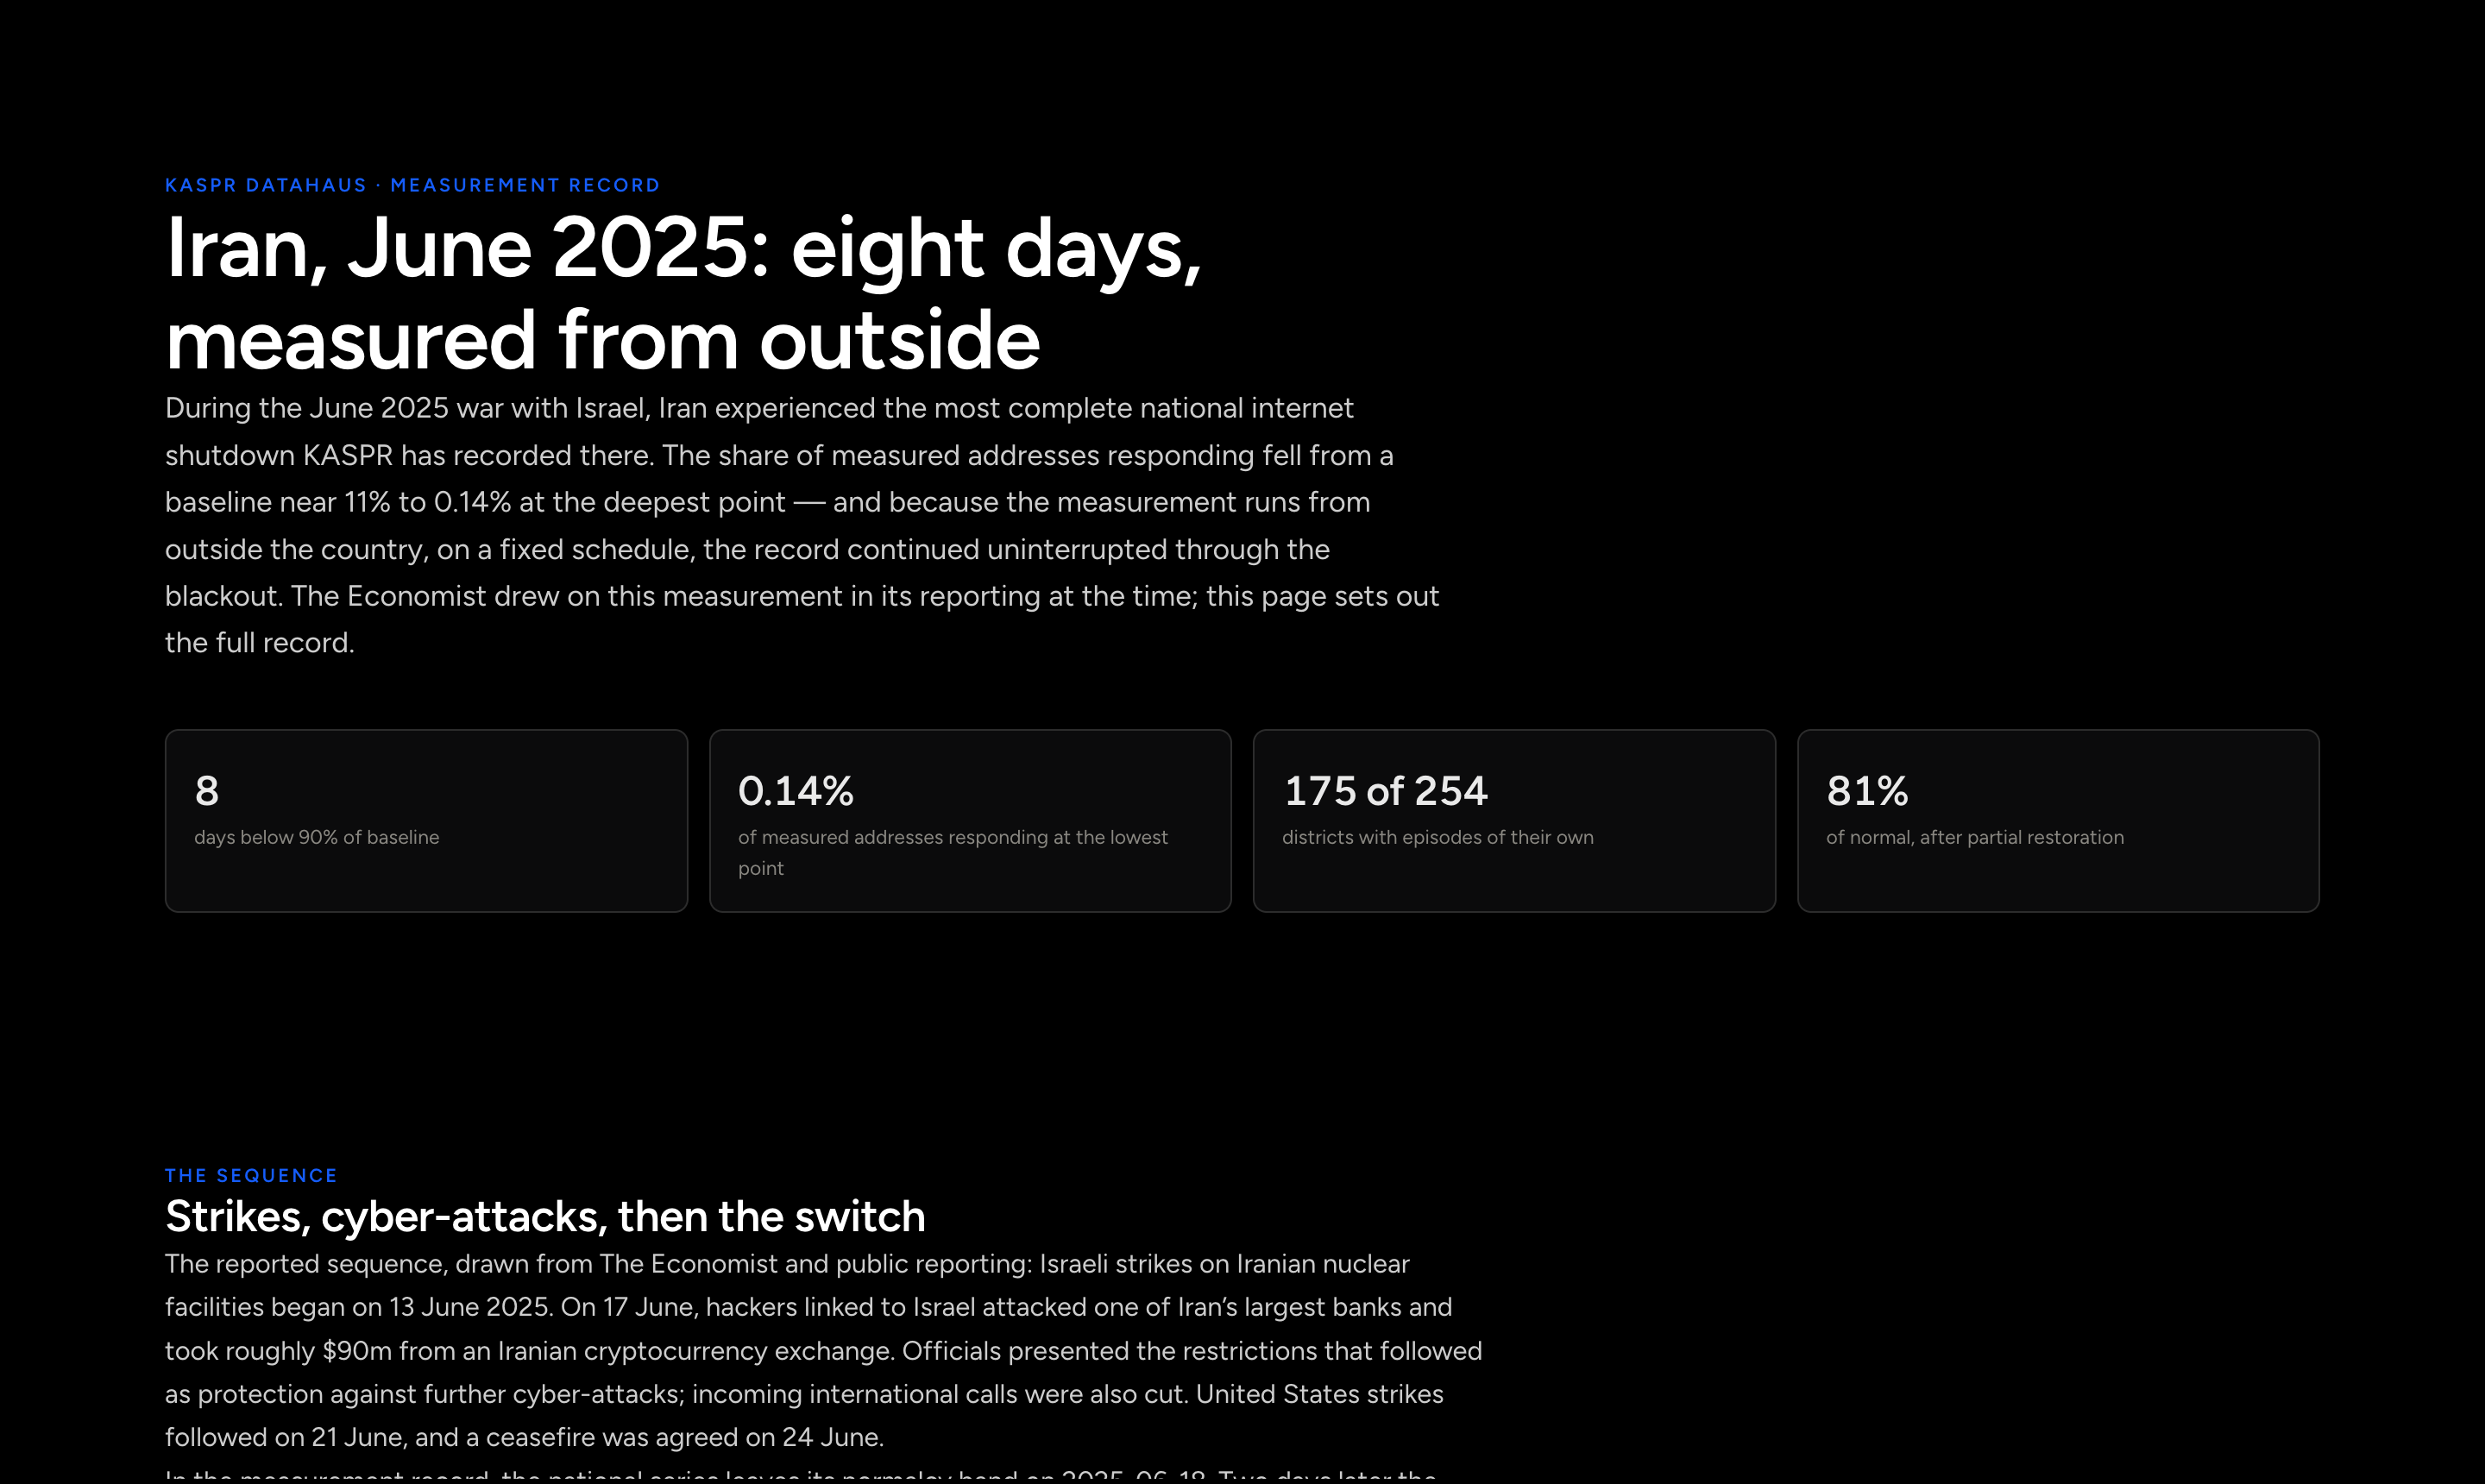
Measuring the June 2025 internet shutdown in Iran from outside the country
Jun 2025

Measuring the June 2025 internet shutdown in Iran from outside the country

During the June 2025 war, the share of measured addresses responding fell from about 11% to 0.15% within two days, and 175 districts recorded episodes of their own. The Economist used this measurement in its coverage at the time.

Signal · the shutdown’s timing, depth and geography, as measured

Action · follow national events as they open

Jan 2026

Iran, January 2026: twenty days below baseline, district by district

The national series stayed below its baseline from 8 to 27 January 2026. 163 of the 254 measured districts recorded episodes of their own inside that window. The brief gives the depth, the duration and a province table.

Signal · a disruption bounded within hours, not weeks

Action · watch live events as they open

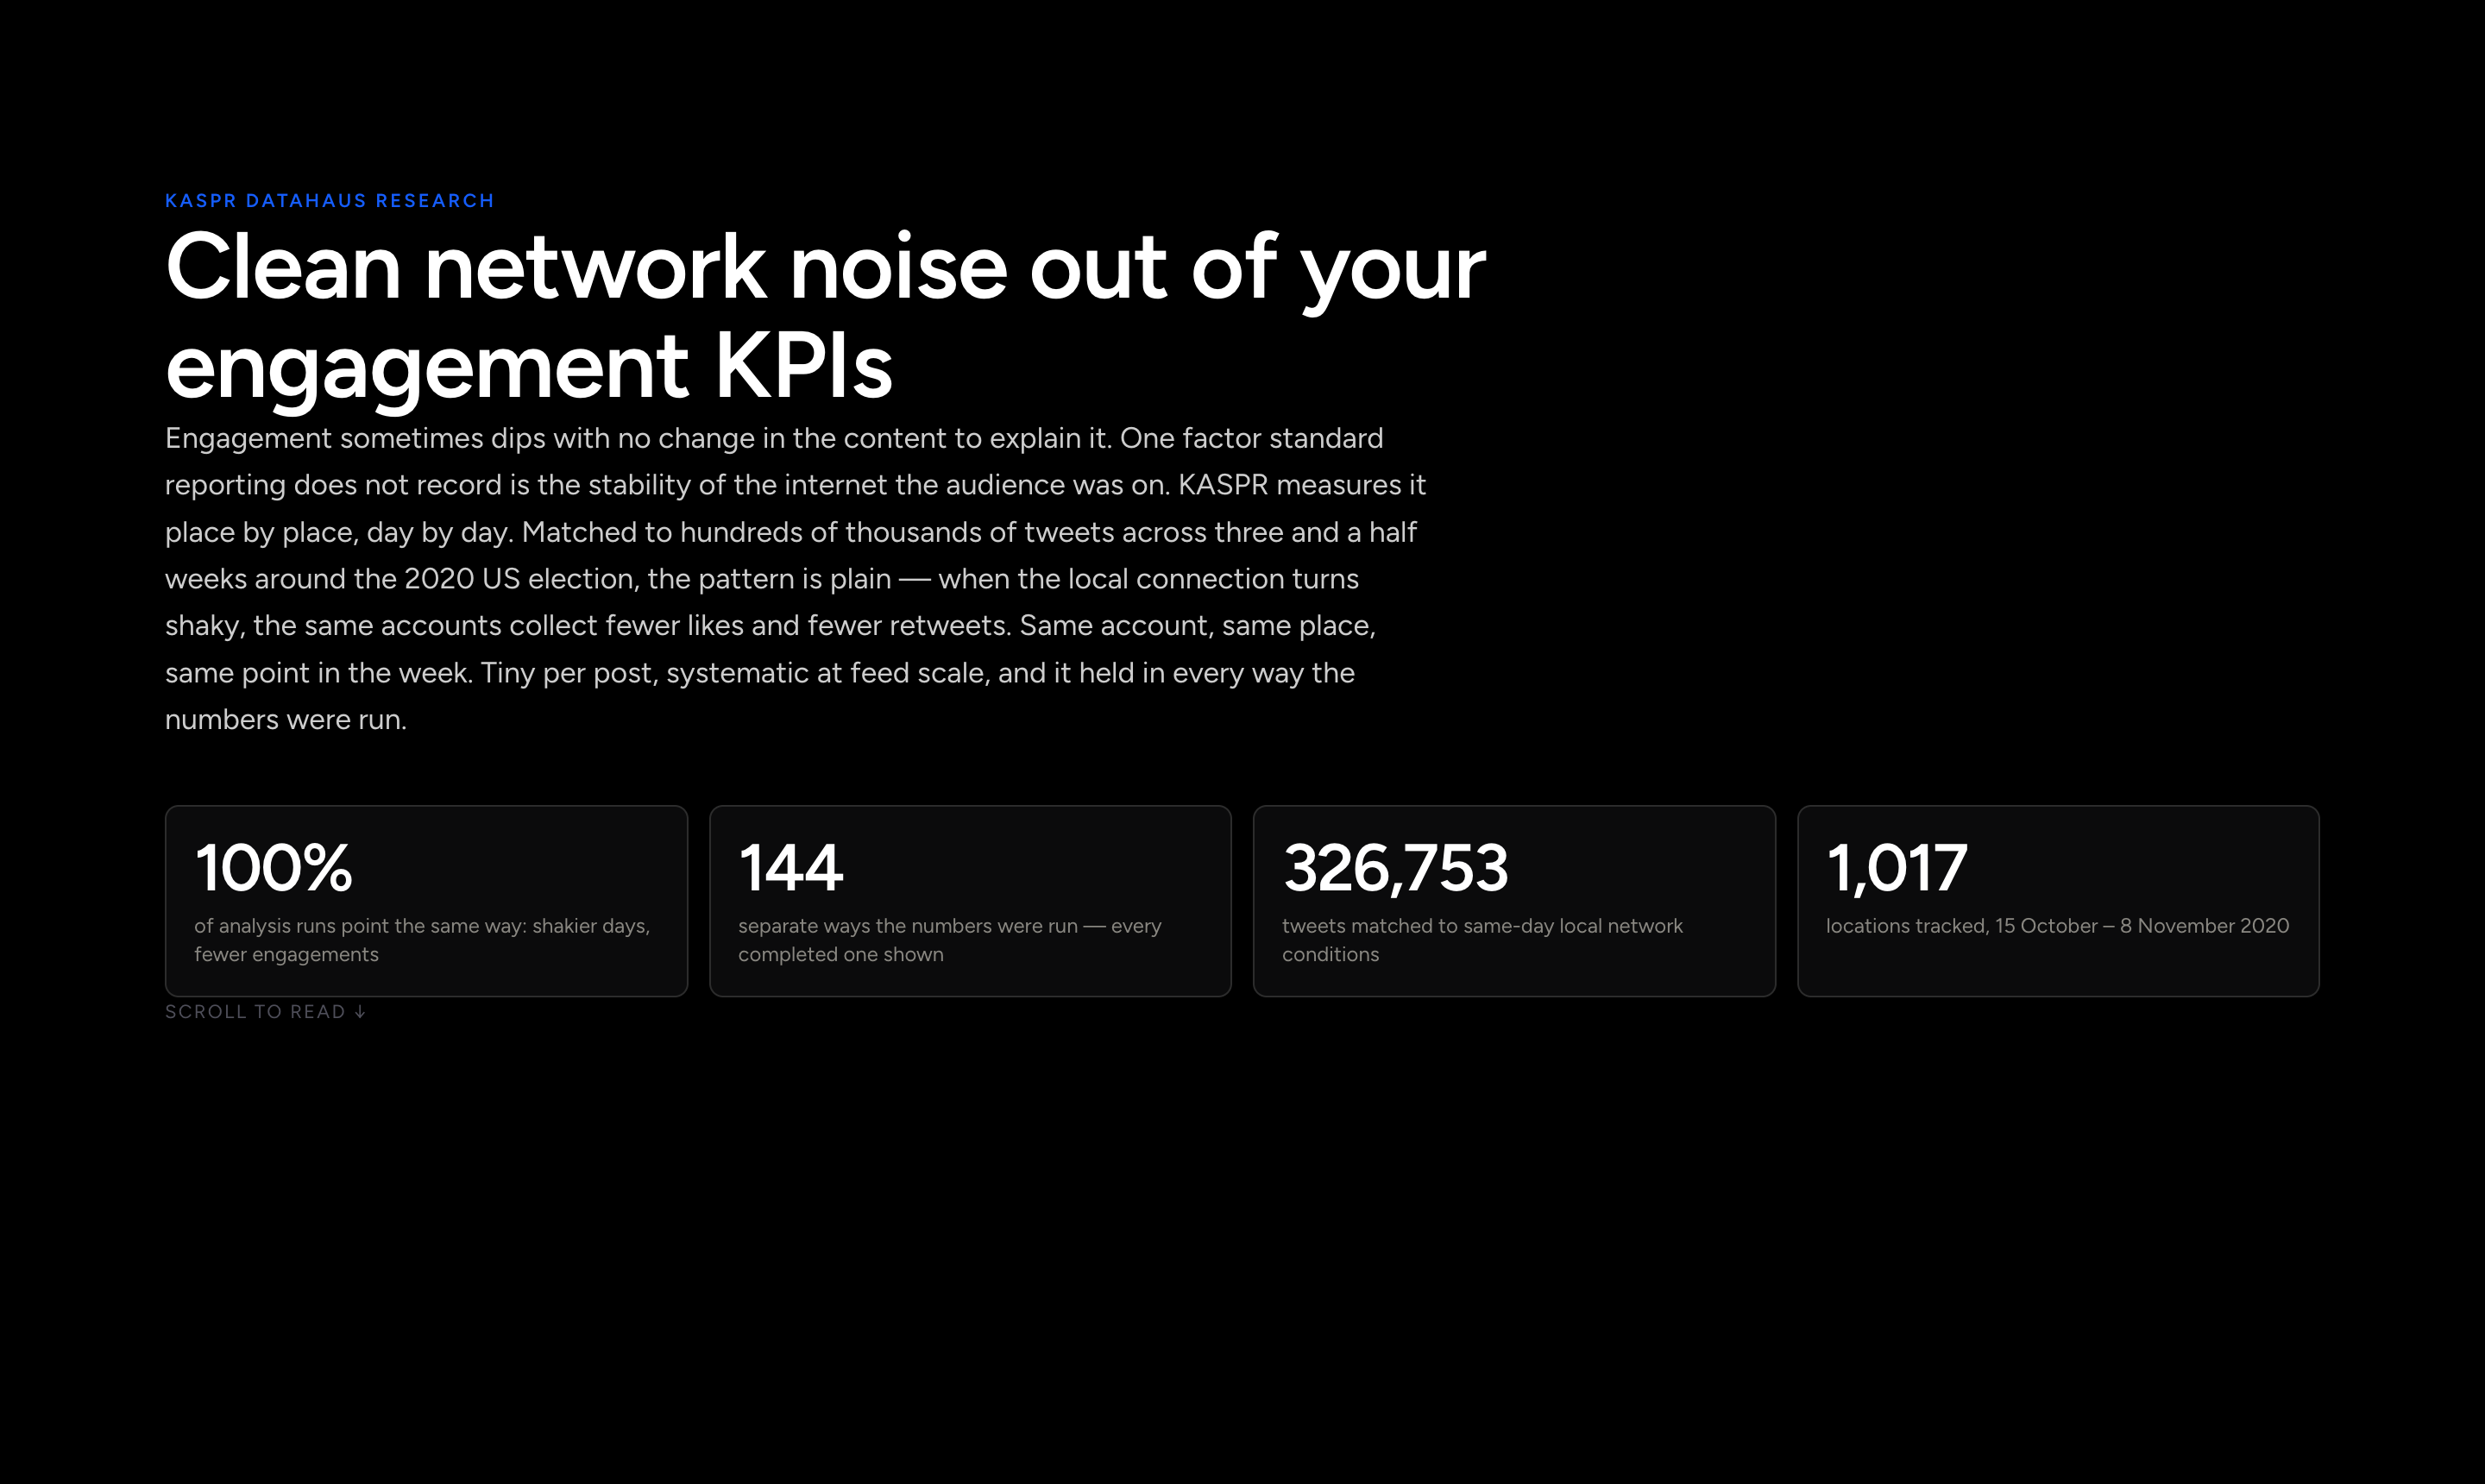
Does a shaky connection change how people engage on social media?
Oct–Nov 2020

Does a shaky connection change how people engage on social media?

Hundreds of thousands of tweets around the 2020 US election, matched to the same day’s local network conditions. On worse days the same accounts got fewer likes and retweets. All 144 analysis runs pointed the same way; no way of slicing the data flipped the result.

Signal · a network term your attribution model is missing

Action · join the series to your own engagement KPIs

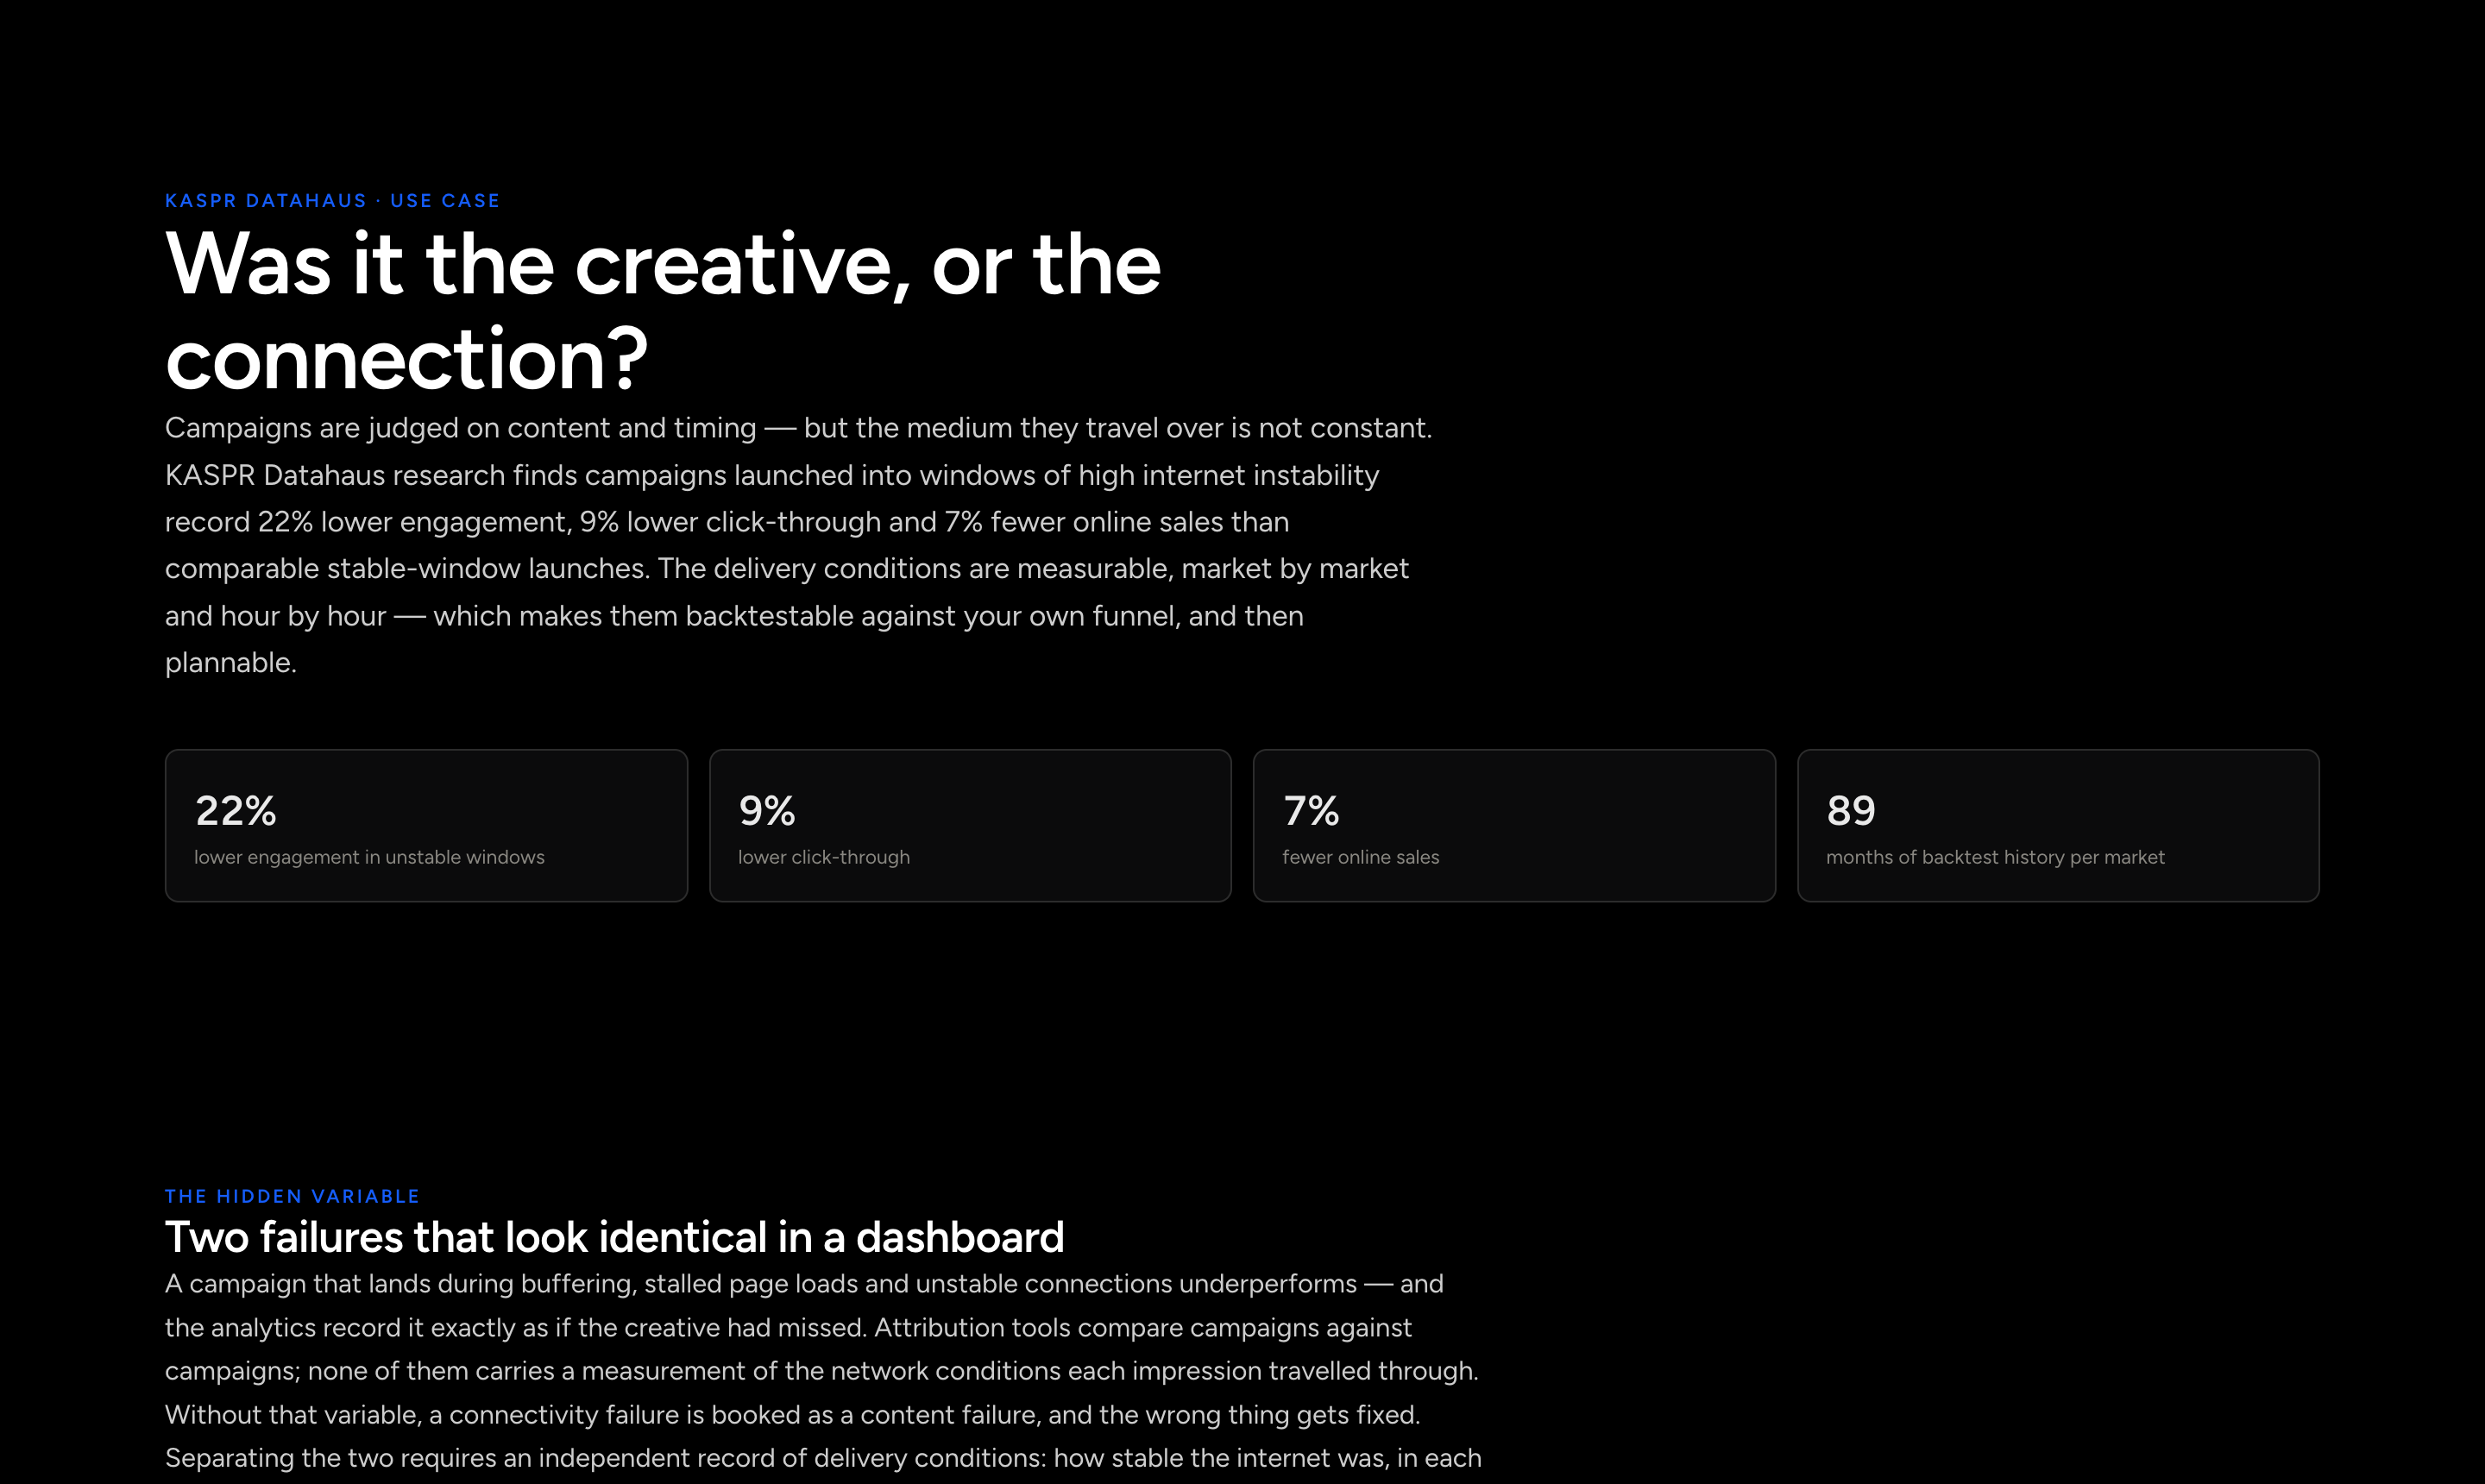
Adding local delivery conditions to a campaign calendar
89-month backtest

Adding local delivery conditions to a campaign calendar

Seven years of monthly jitter for the United States, Italy and India show what rough delivery windows cost a funnel. Broadcast then ranks the coming week’s posting windows by how much of your audience sits in good conditions.

Signal · delivery conditions, measurable and plannable

Action · rank this week’s windows for your audience mix

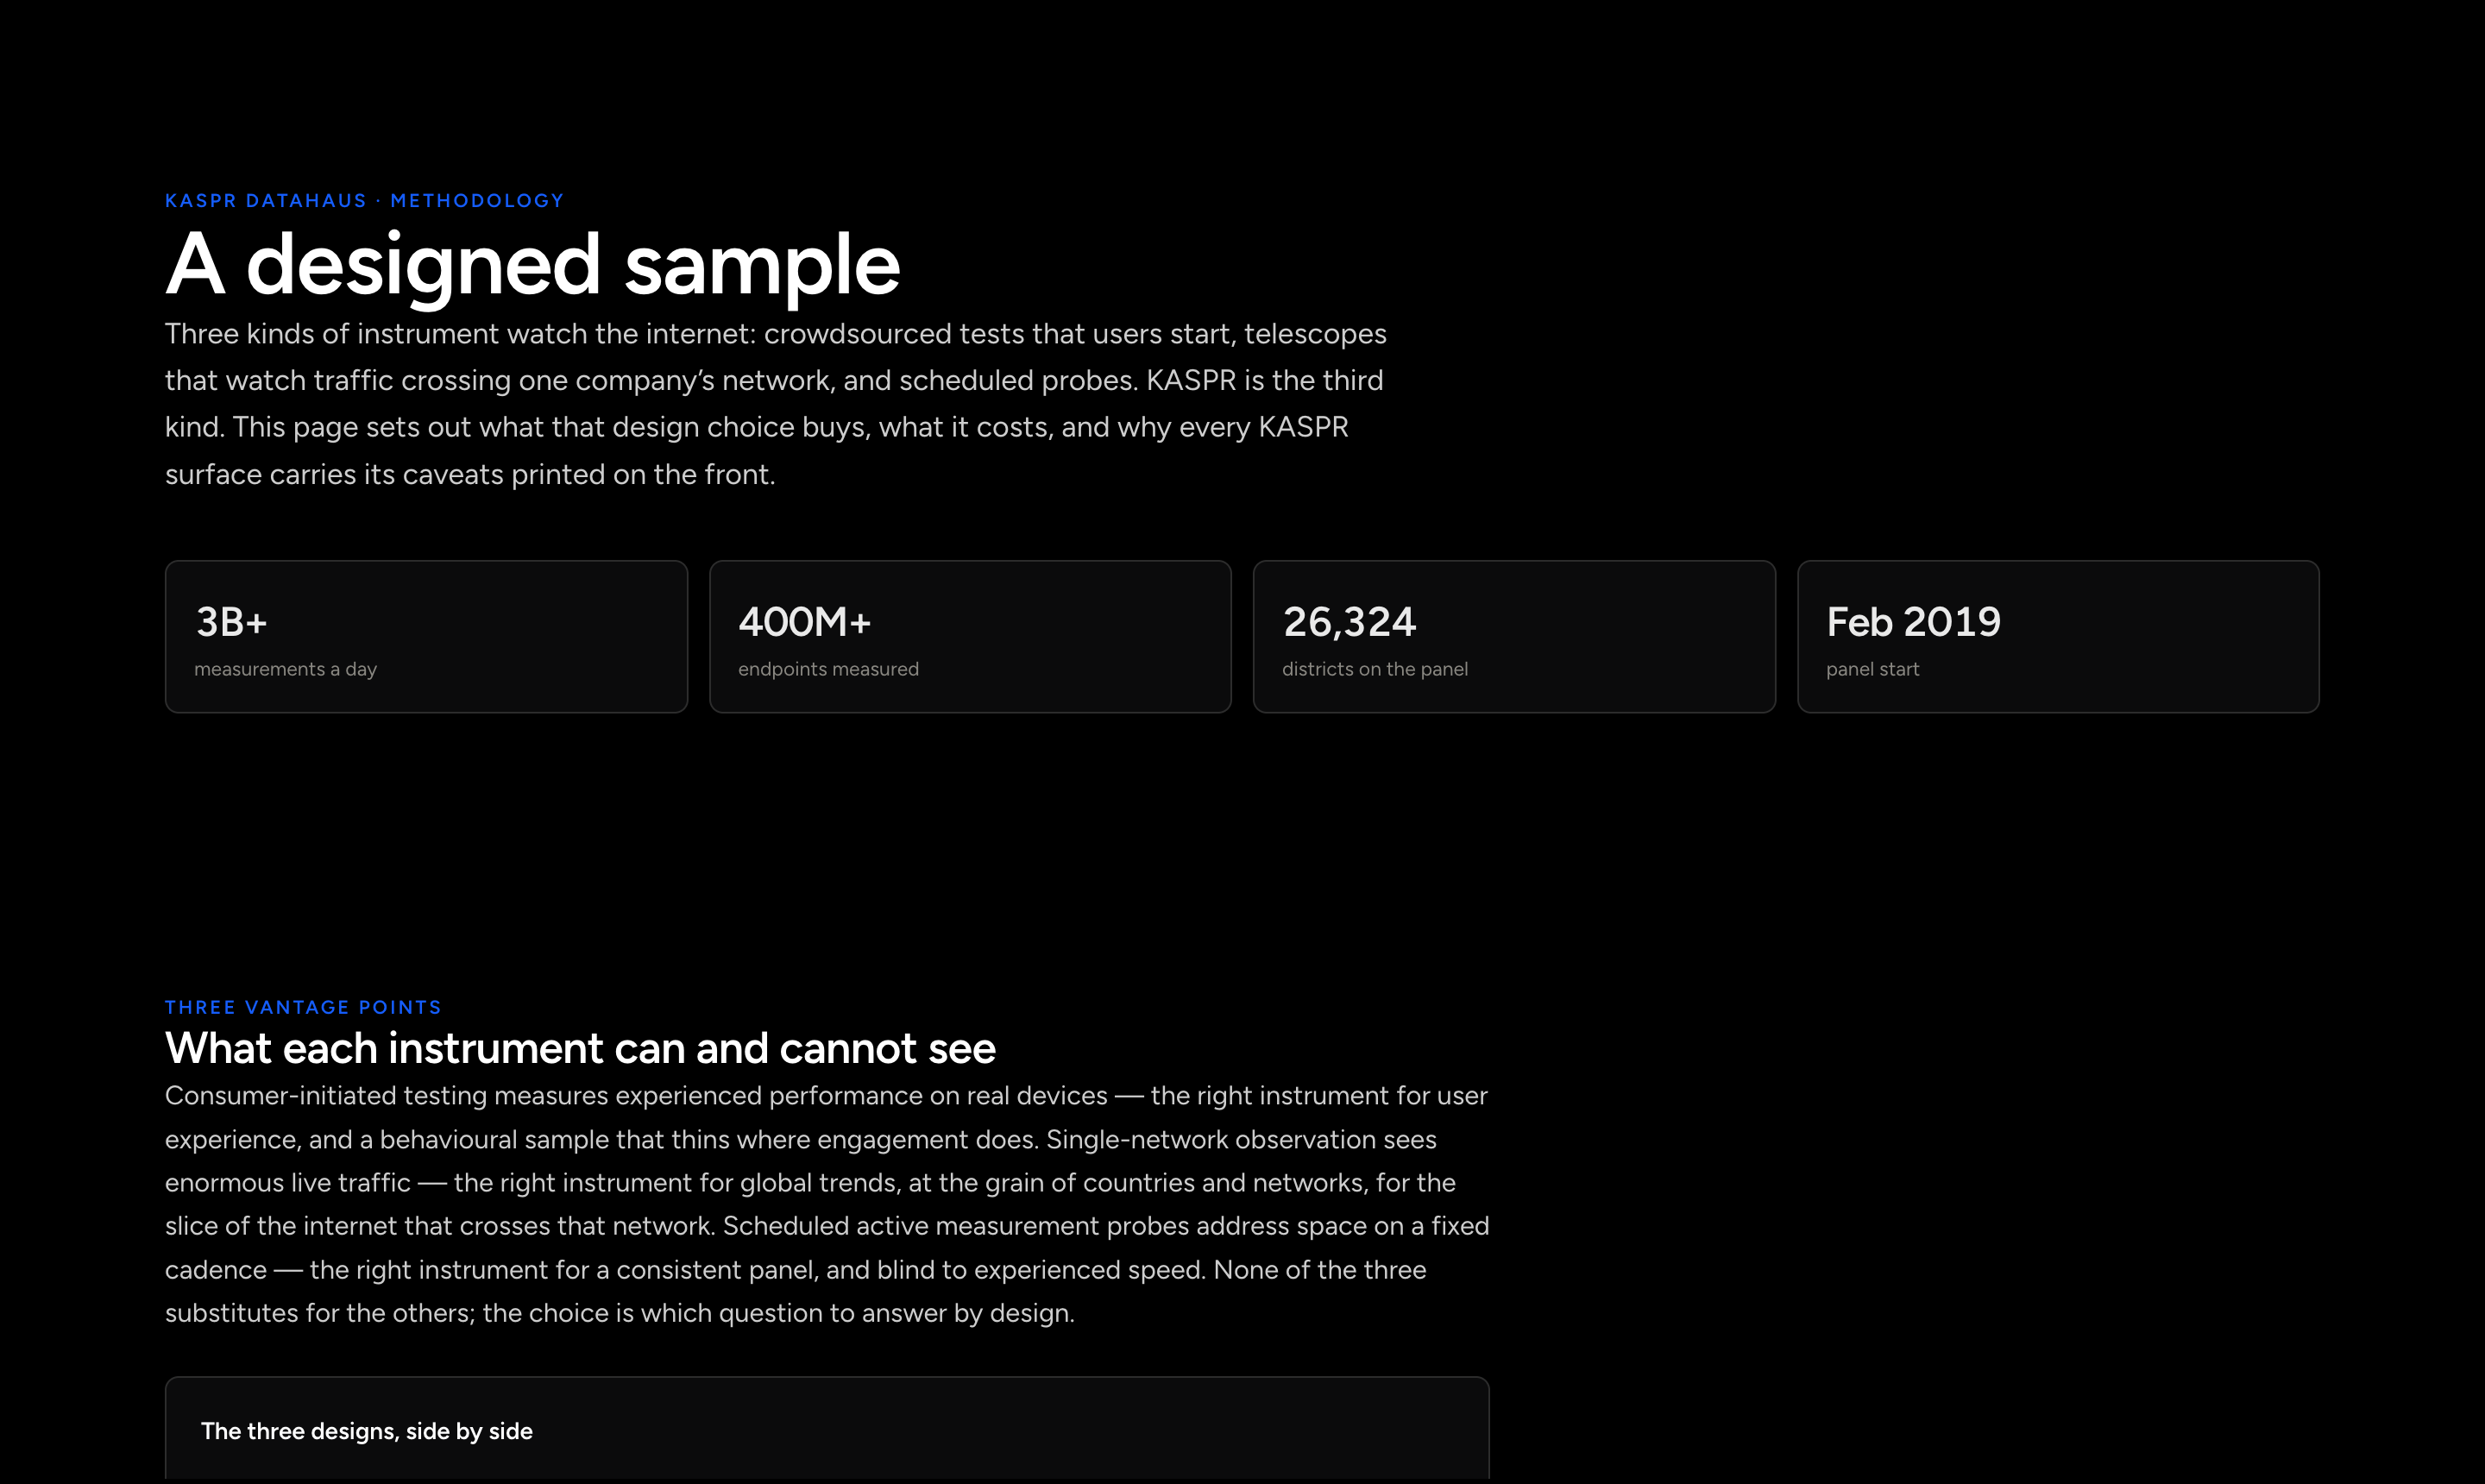
Three ways to measure the internet, and what each one can tell you
Since Feb 2019

Three ways to measure the internet, and what each one can tell you

User-started speed tests follow the users; a network’s own telescope sees only its own traffic. Scheduled probing measures 26,324 districts the same way, every hour, since 2019, which is the panel the other two designs cannot produce.

Signal · a sample designed for estimation, not engagement

Action · read how the instrument works before you rely on it

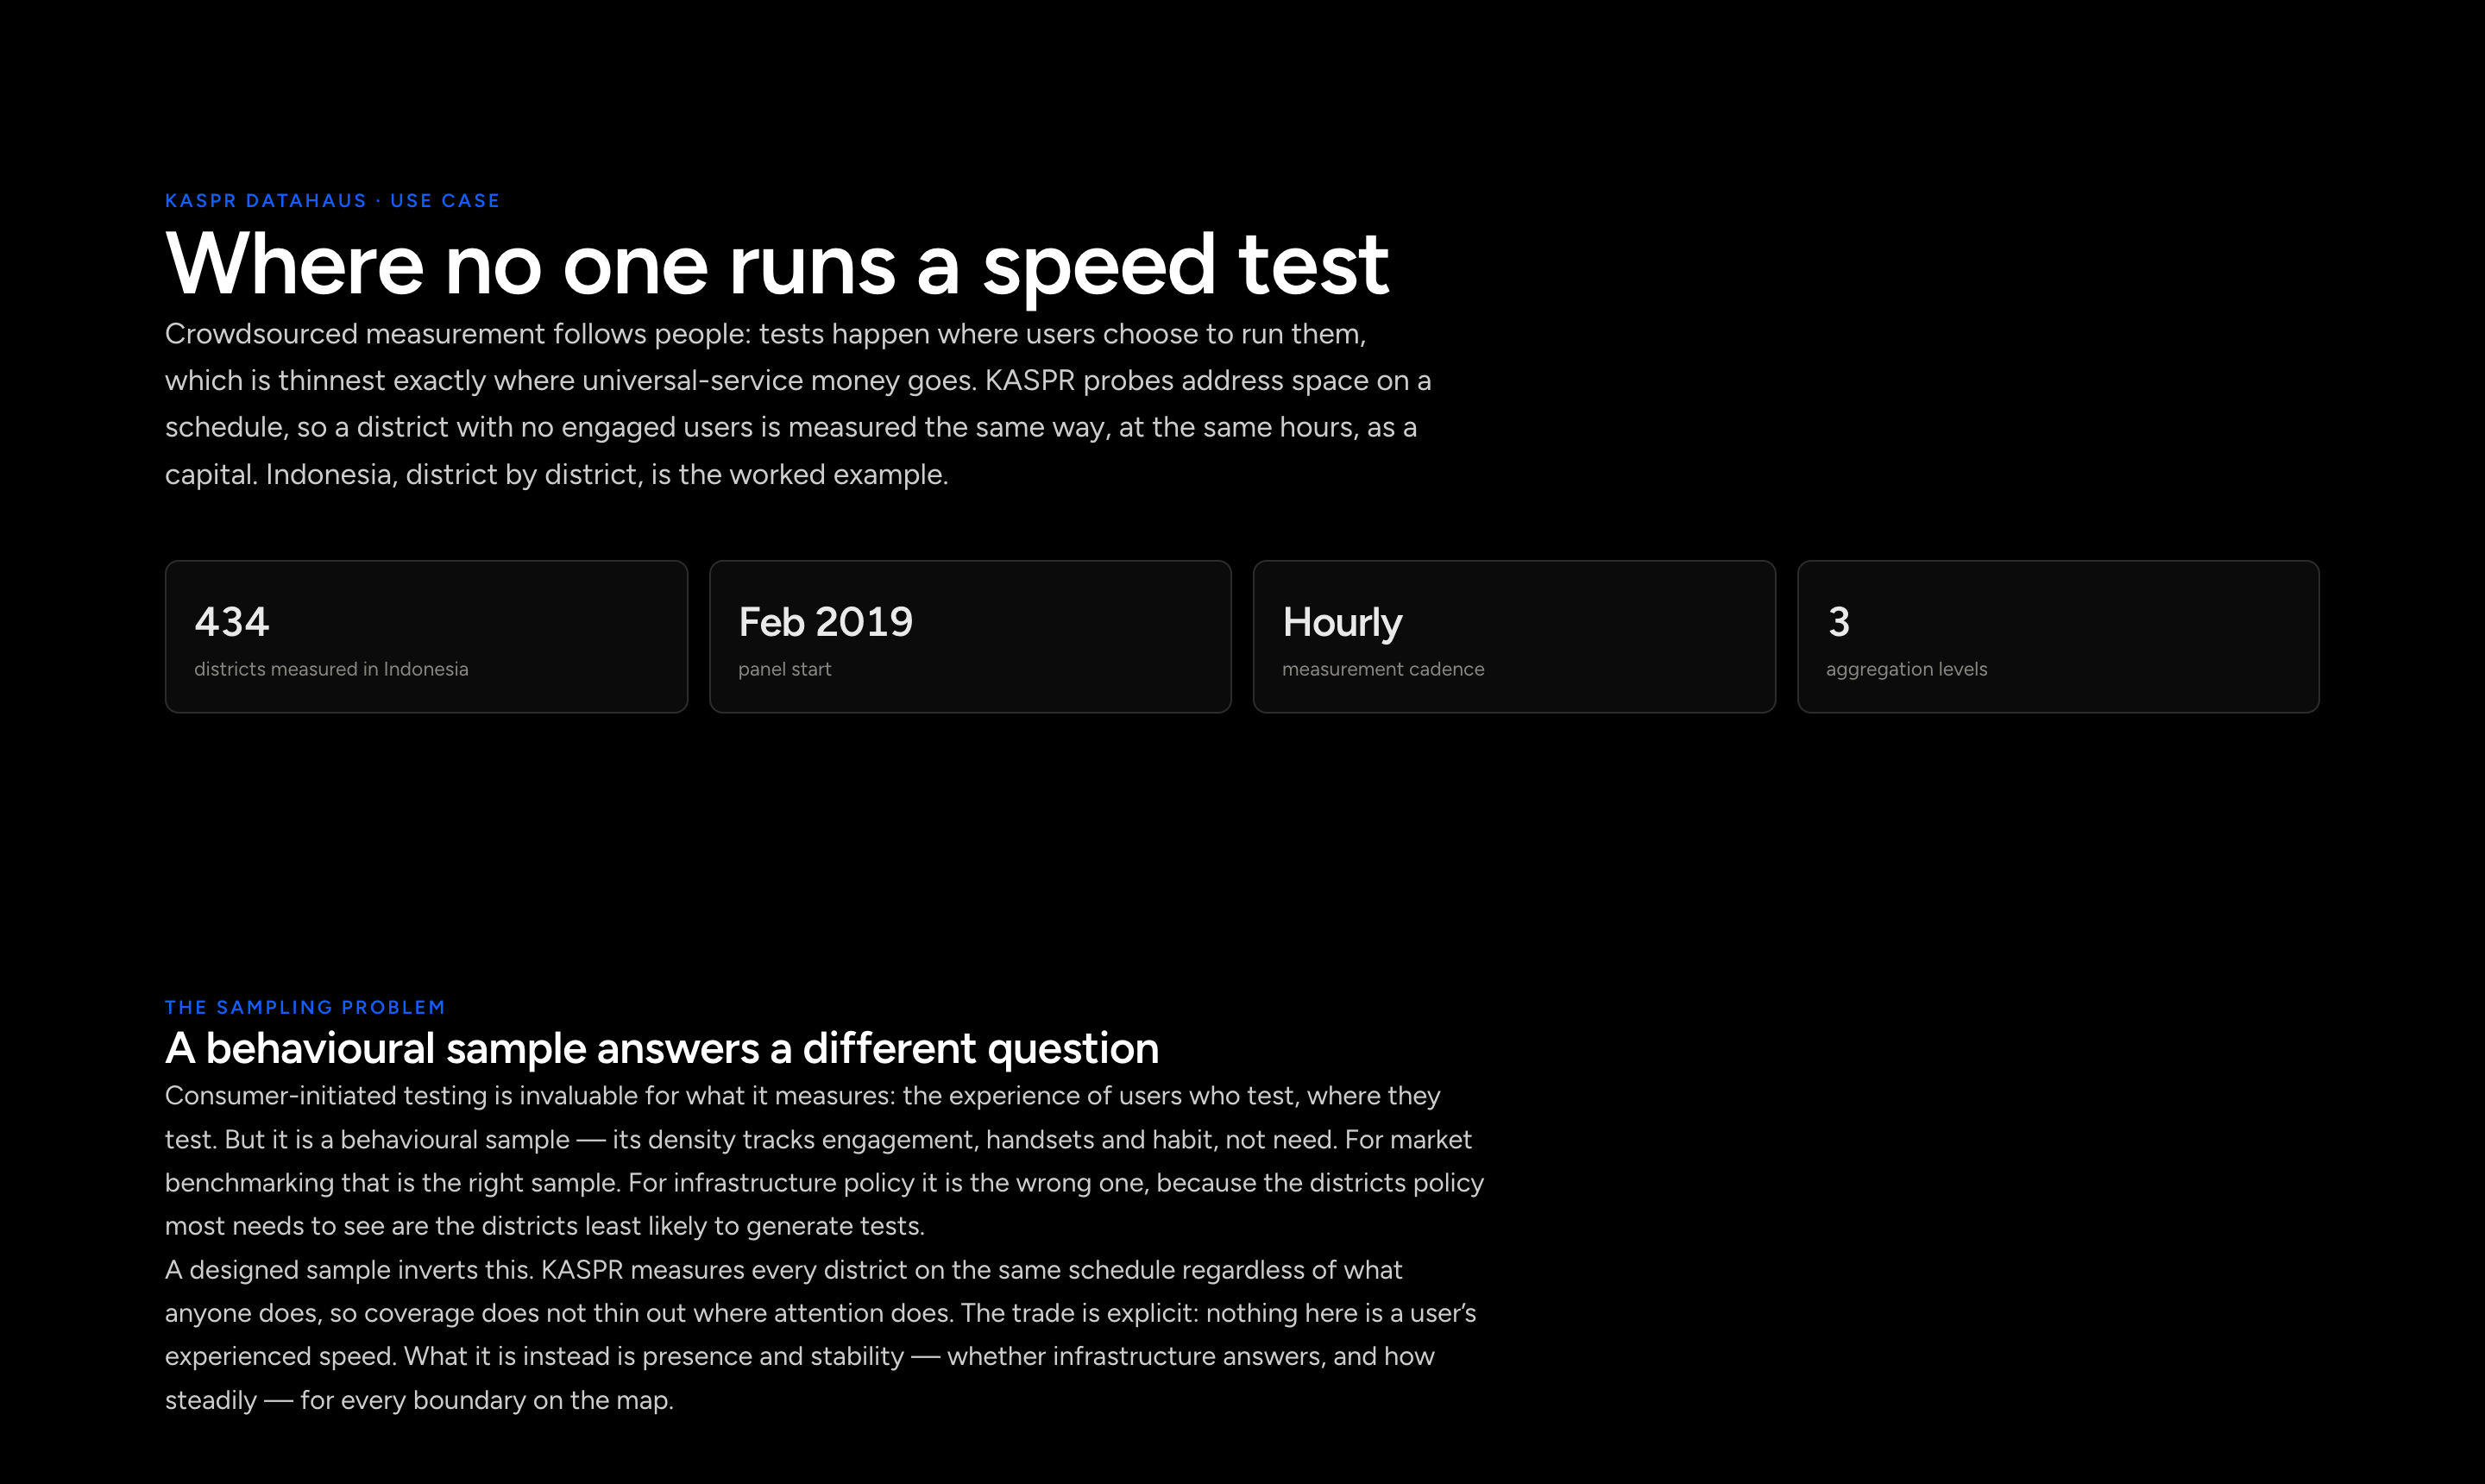
Ranking all 434 Indonesian districts by connectivity, measured the same way
Jul 2026 vintage

Ranking all 434 Indonesian districts by connectivity, measured the same way

Crowdsourced speed tests are thinnest exactly where universal-service money is meant to go. Our panel measures every district identically, so the ranking shows which districts declined year on year, the list a funding review would start from.

Signal · district-level equity, measured not reported

Action · rank any country’s districts the same way

A parametric outage-insurance trigger, worked through for one district
2019–2025

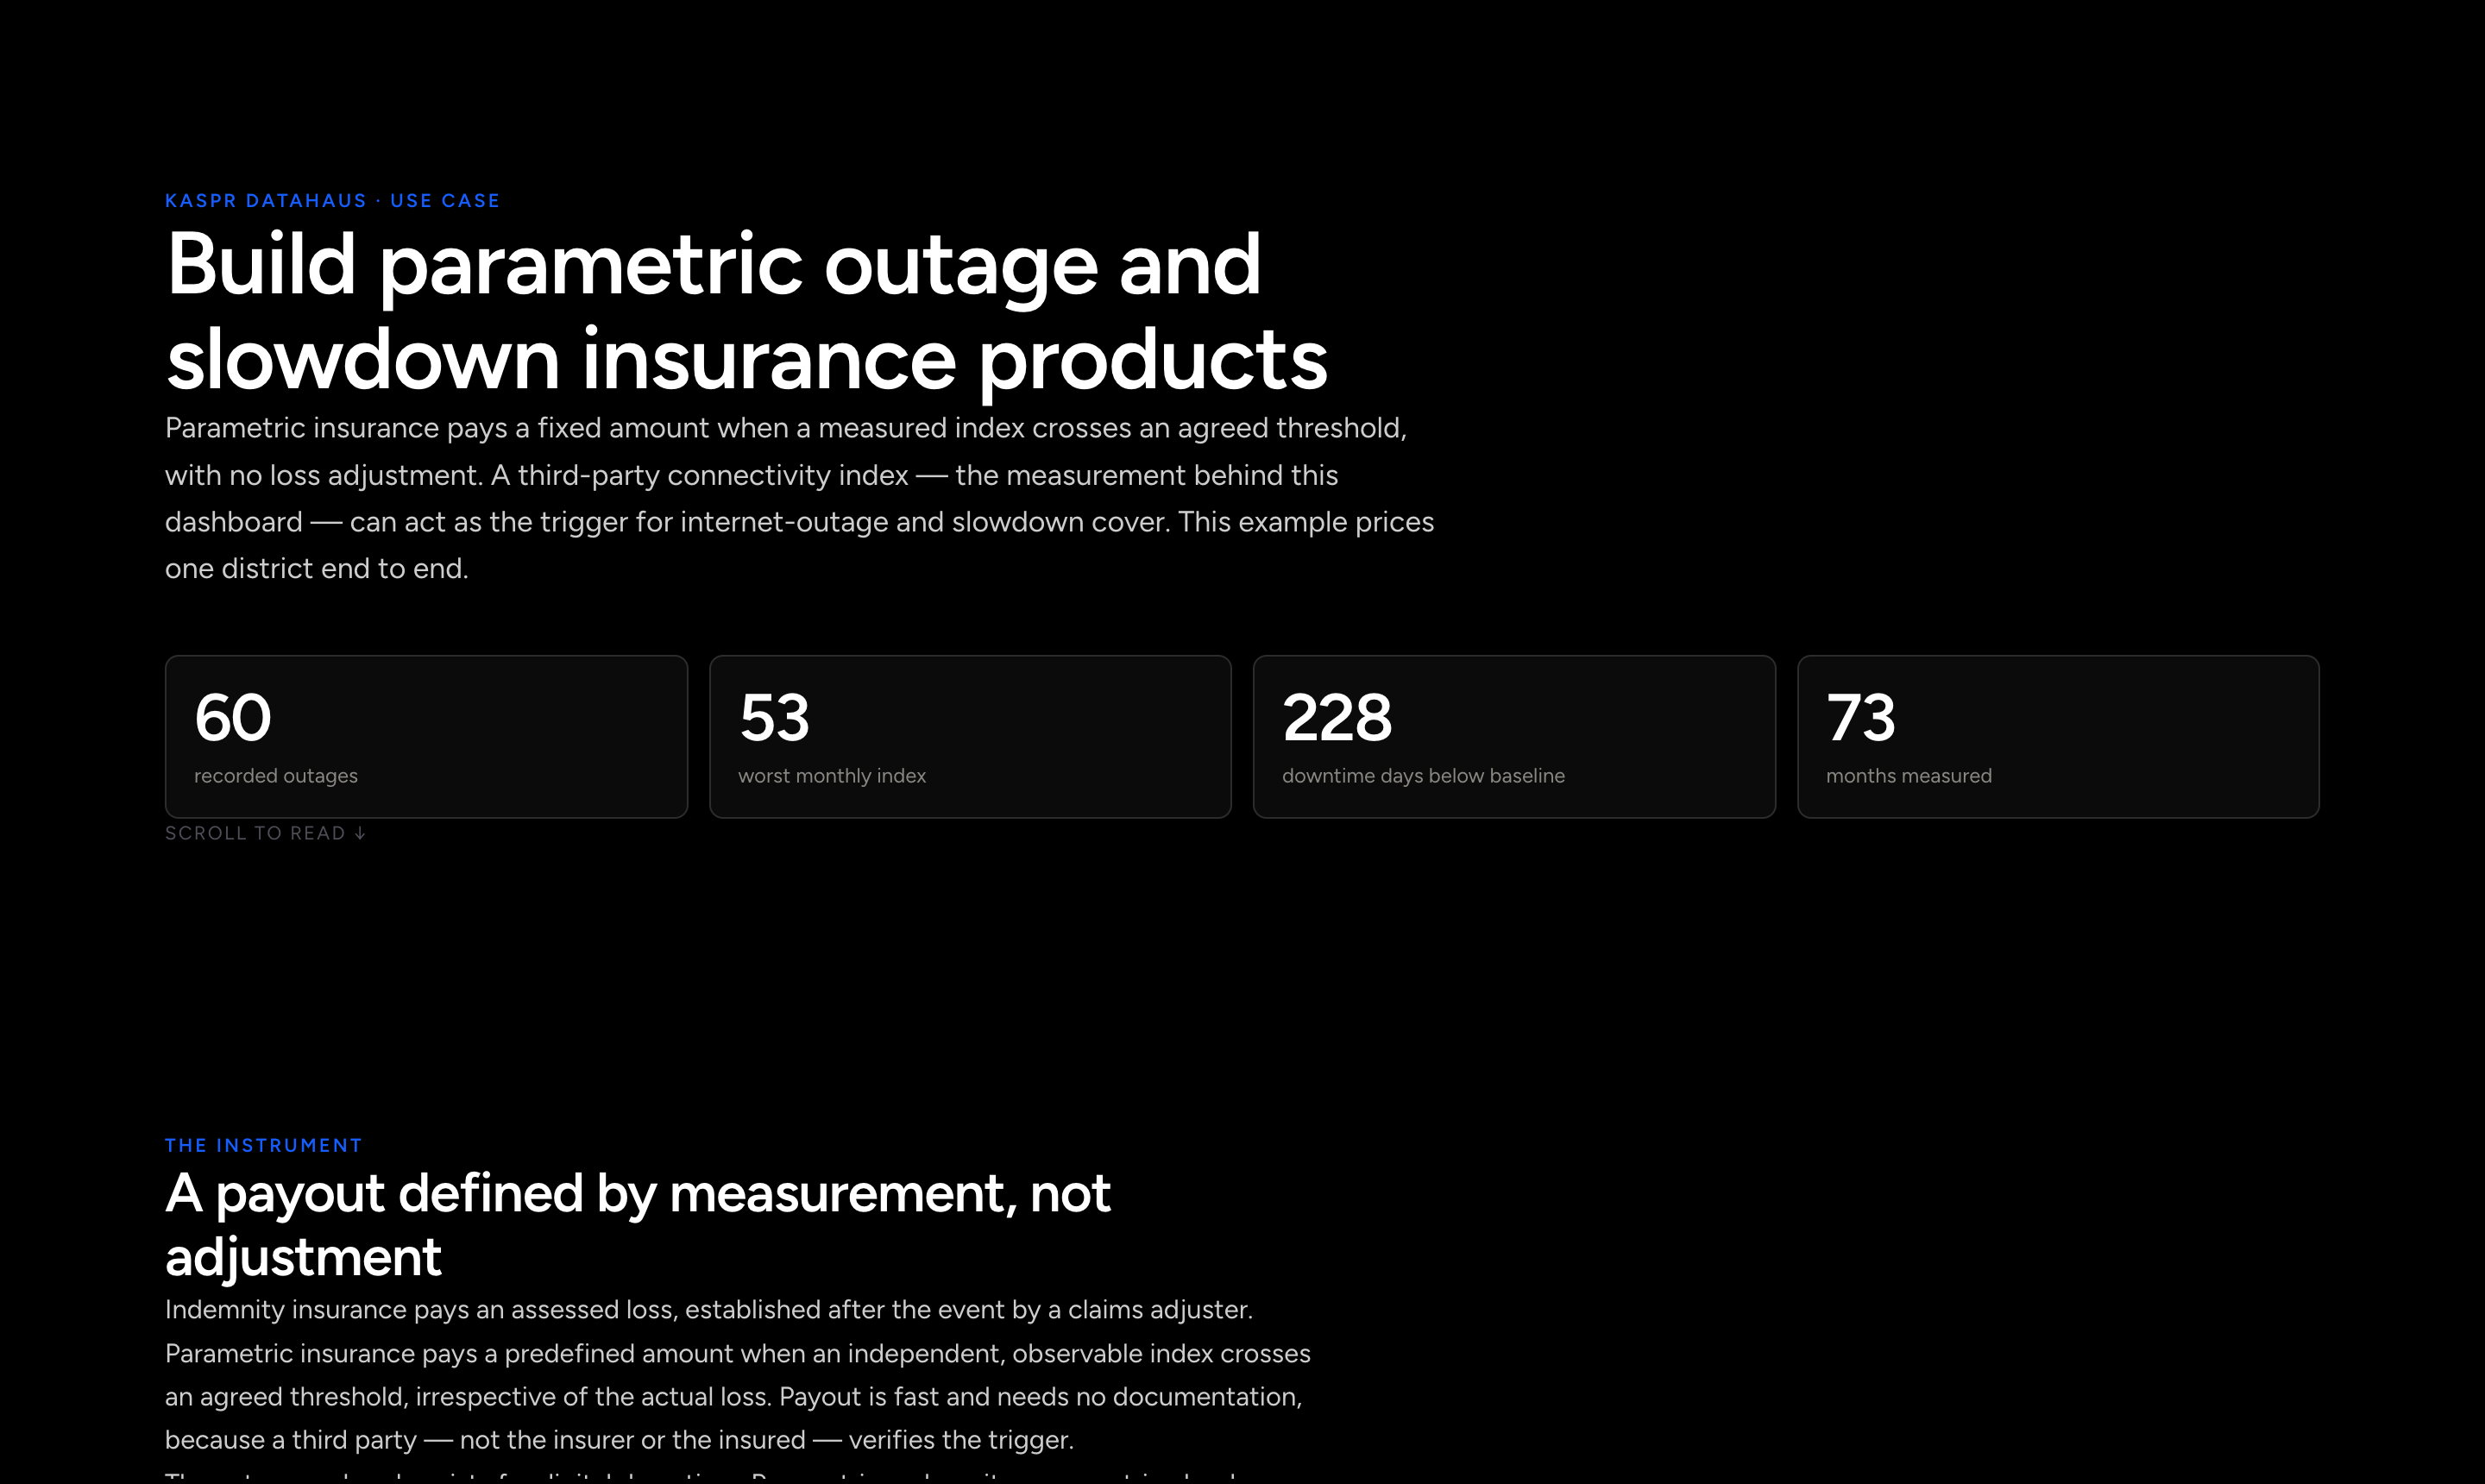
A parametric outage-insurance trigger, worked through for one district

Malvar in Batangas, the Philippines: a monthly connectivity index scored against its own normal of 100. The example counts the months that fell below the trigger line, turns them into a loss distribution and prices a premium, the whole chain from measurement to policy.

Signal · an auditable third-party trigger

Action · define a trigger on any measured district

The connectivity record around every data-centre site
Live

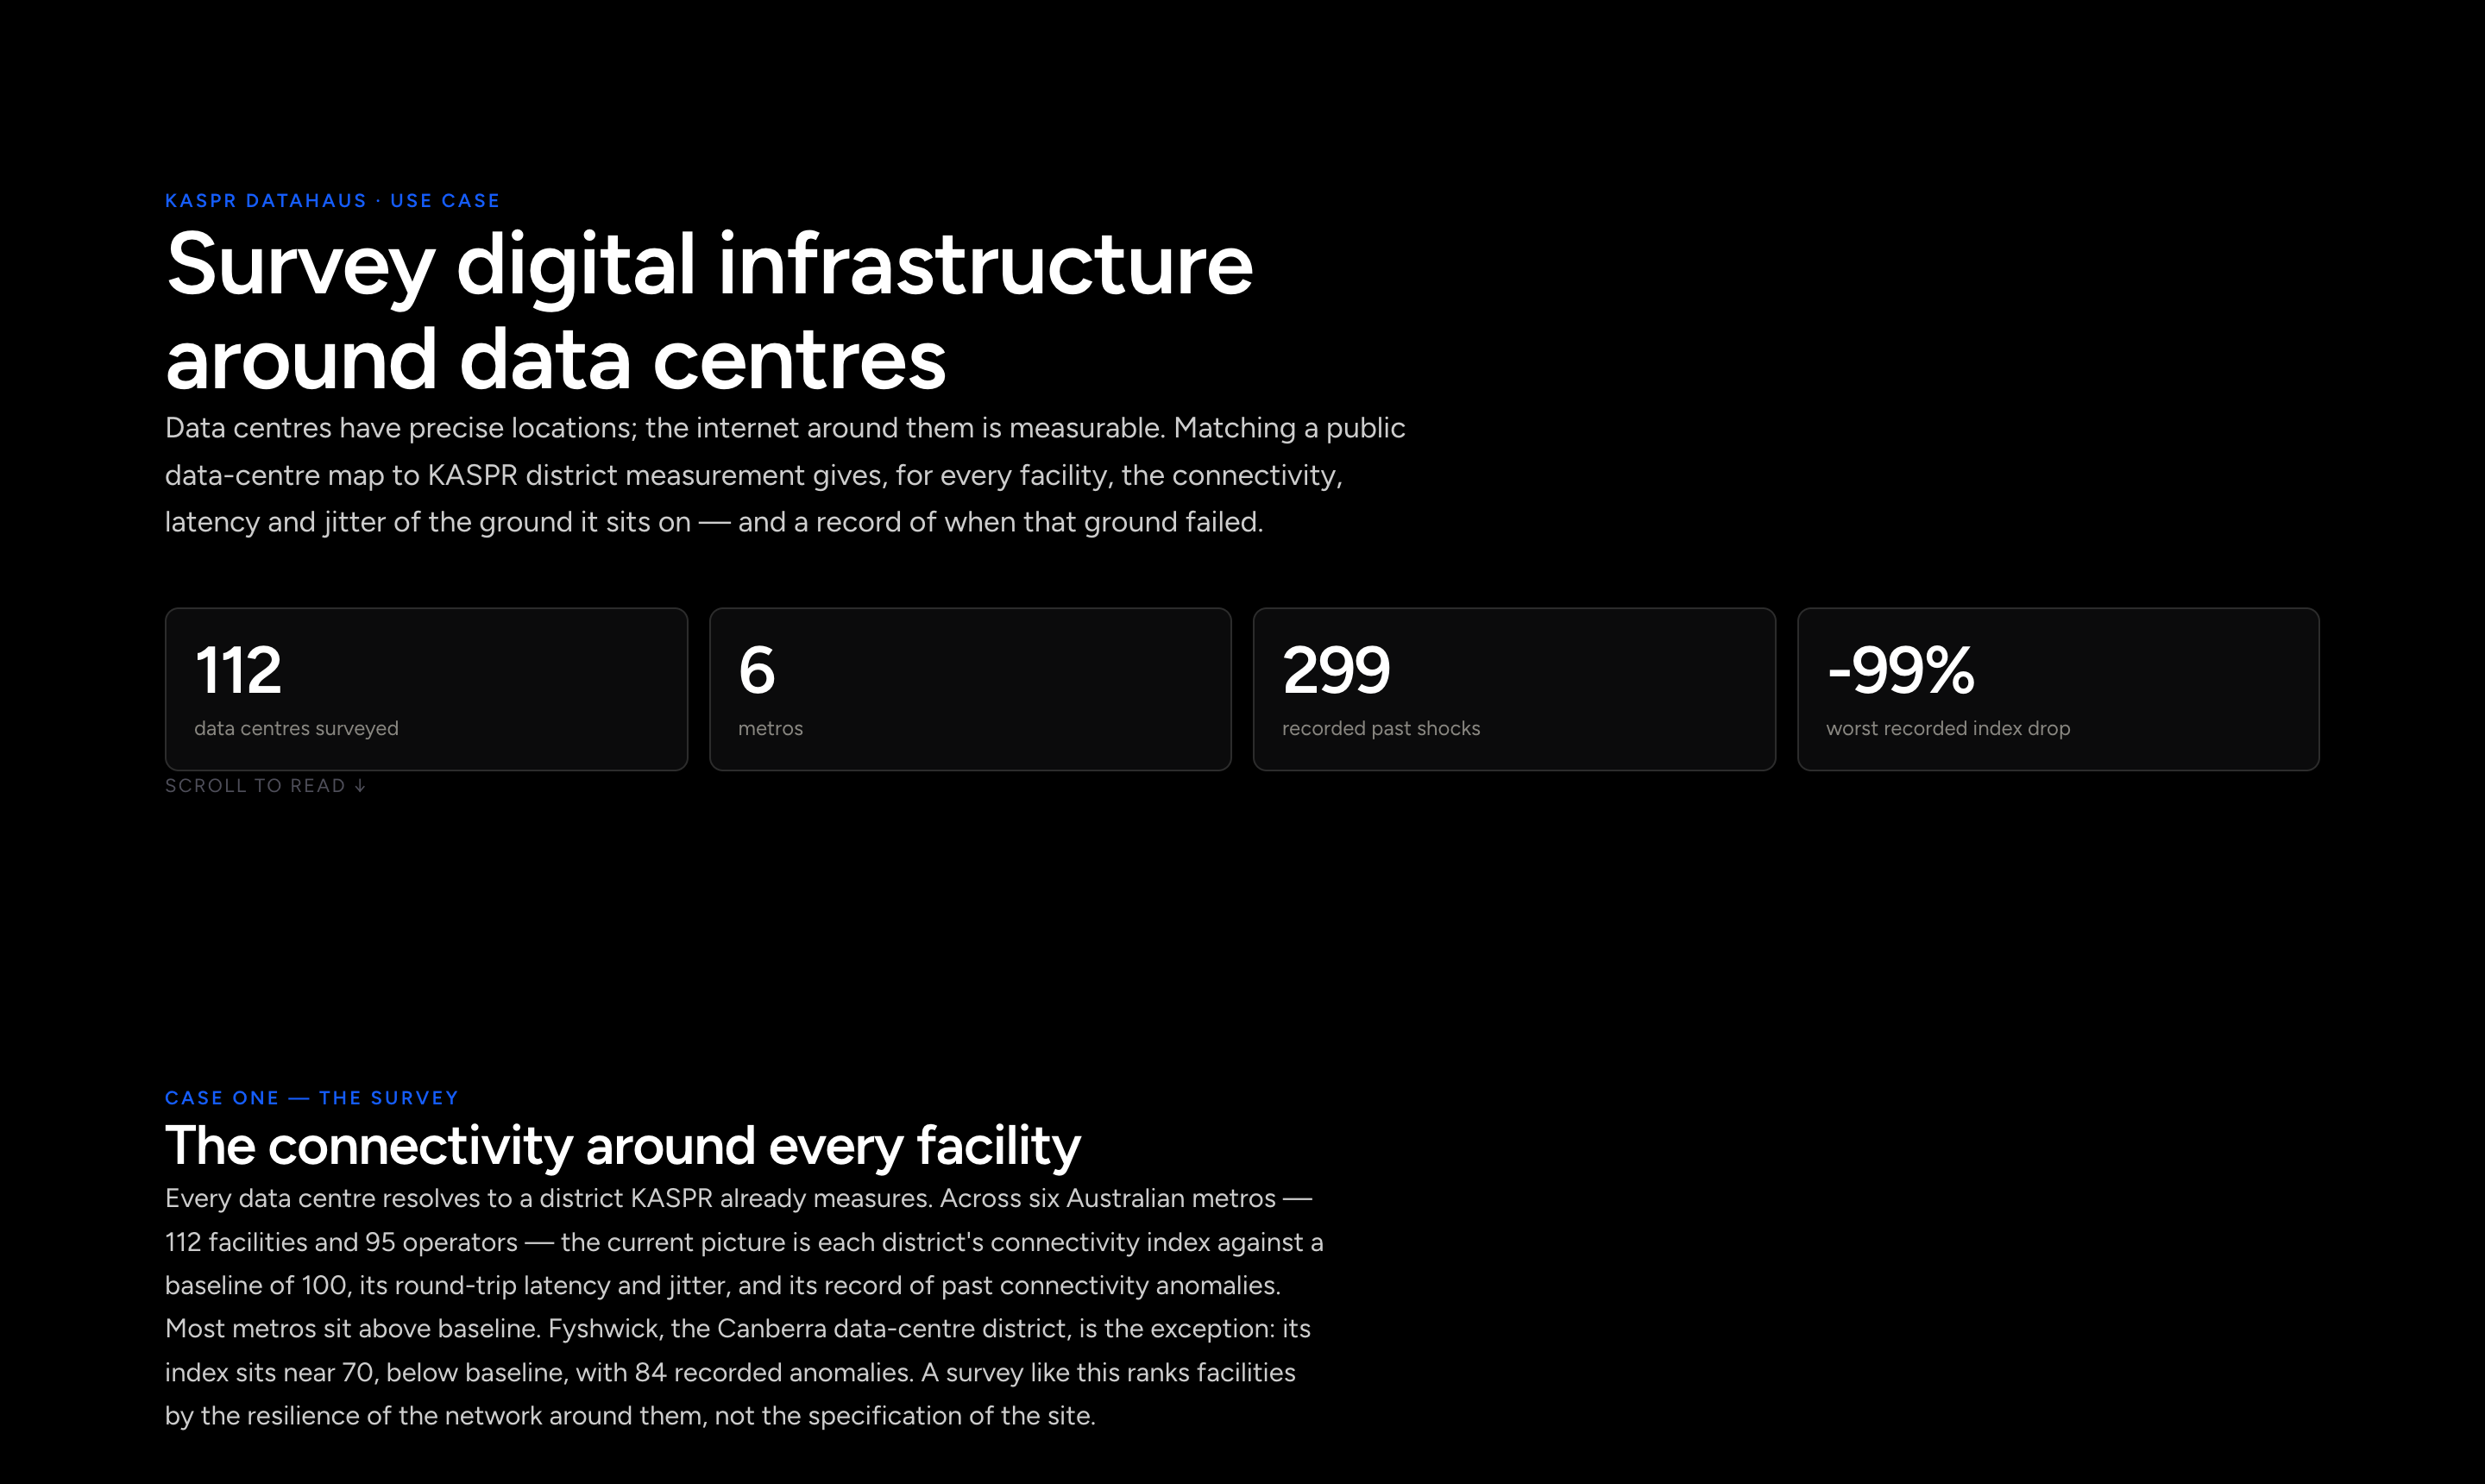
The connectivity record around every data-centre site

Public data-centre locations matched to the districts we measure. For each site you see the connectivity, latency and jitter around it over time, and you get an alert when its district breaks.

Signal · site-level connectivity risk

Action · survey any facility list against the map

How local internet speed changes how fast share prices react to news
2019–2025

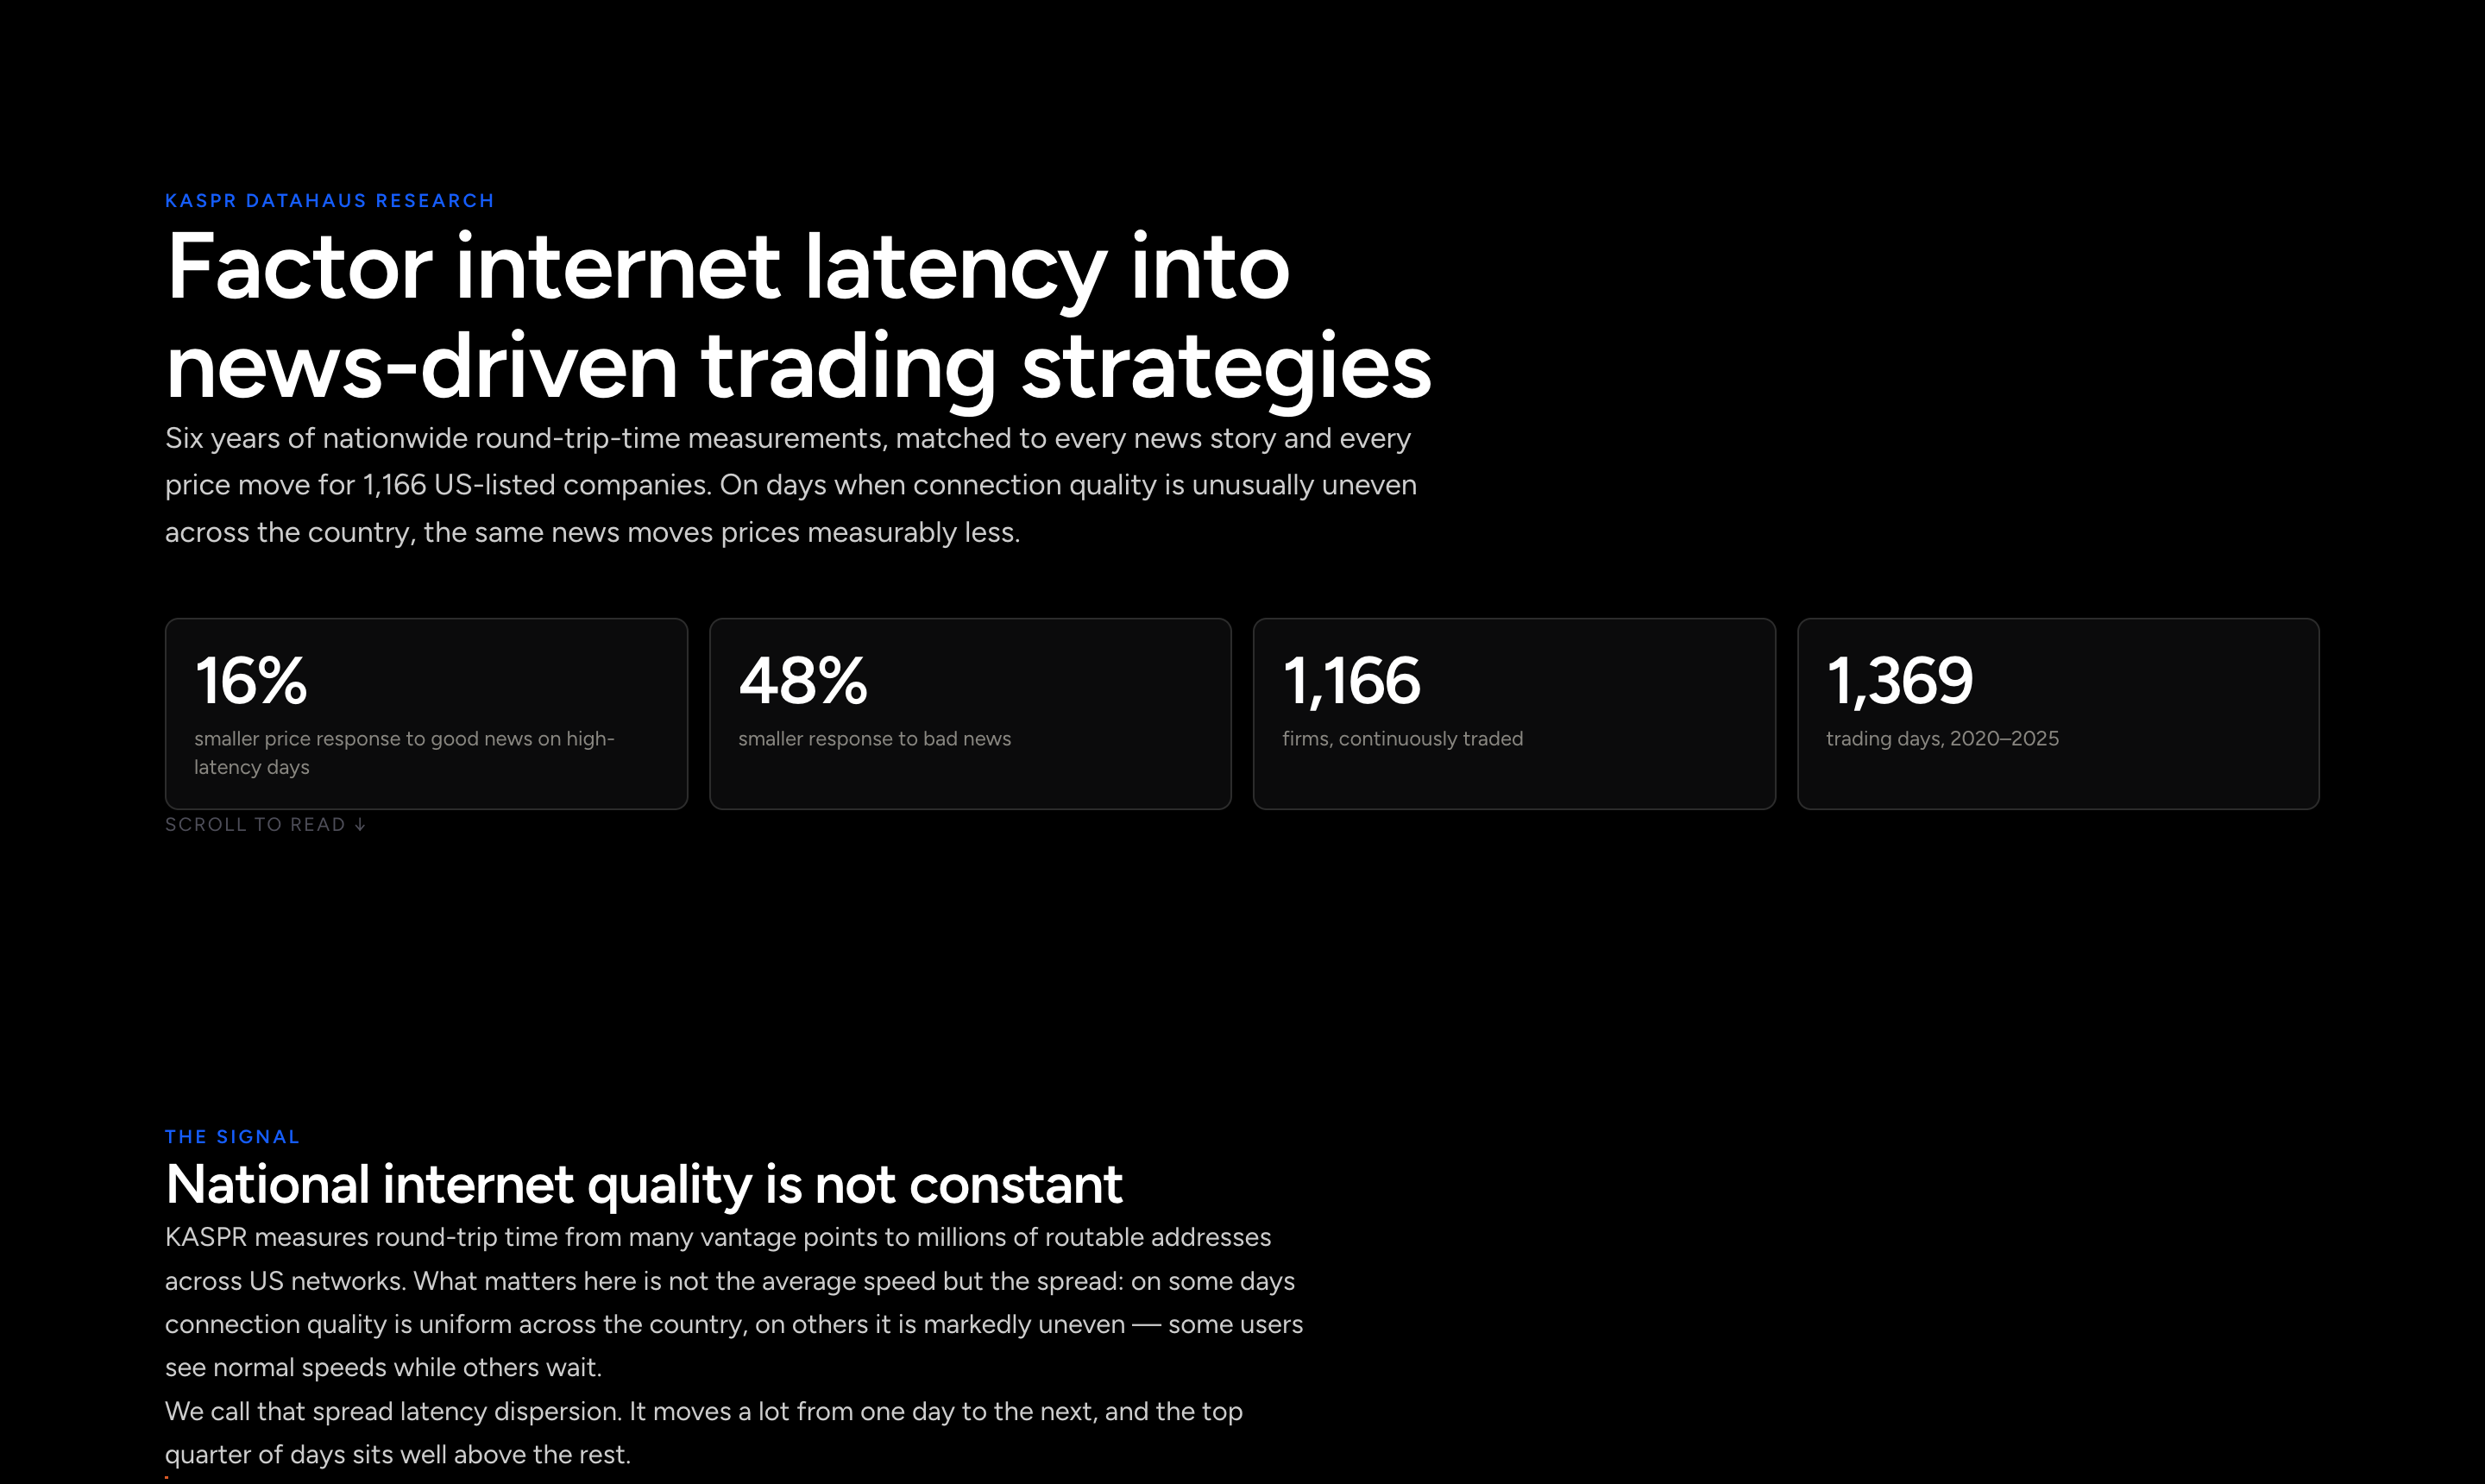
How local internet speed changes how fast share prices react to news

A study of six years of US latency alongside 1,166 stocks. Where the local internet was slower, prices took measurably longer to absorb news. The effect holds across the whole sample rather than in a few stocks, so it can be used as a factor.

Signal · latency as a pricing factor

Action · take the panel into your own backtests