
US midterm elections · 3 November 2026
US midterms 2026: the evening hours when mobile video plays worst in the counties that decide the races
Data vintage 2026-07-16 · evening window 17:00 to 23:00 local time, Monday 2 and Tuesday 3 November
- The Washington Post, “A guide to the key battleground House races this November”, 6 September 2026.
- Reuters Institute for the Study of Journalism, Digital News Report 2025: United States.
- Digiday, “Why the 2026 midterms could mark a turning point for influencers in political campaigns”, 29 October 2026.
137
counties measured, hour by hour
21:00
the roughest evening hour in half of them
10 ms
the swing between the best and worst evening hour in Luzerne County, PA
1.1 ms
the median swing across the 86 counties on the swing lists
The deadline
A video posted on Monday night has one job and one closing time
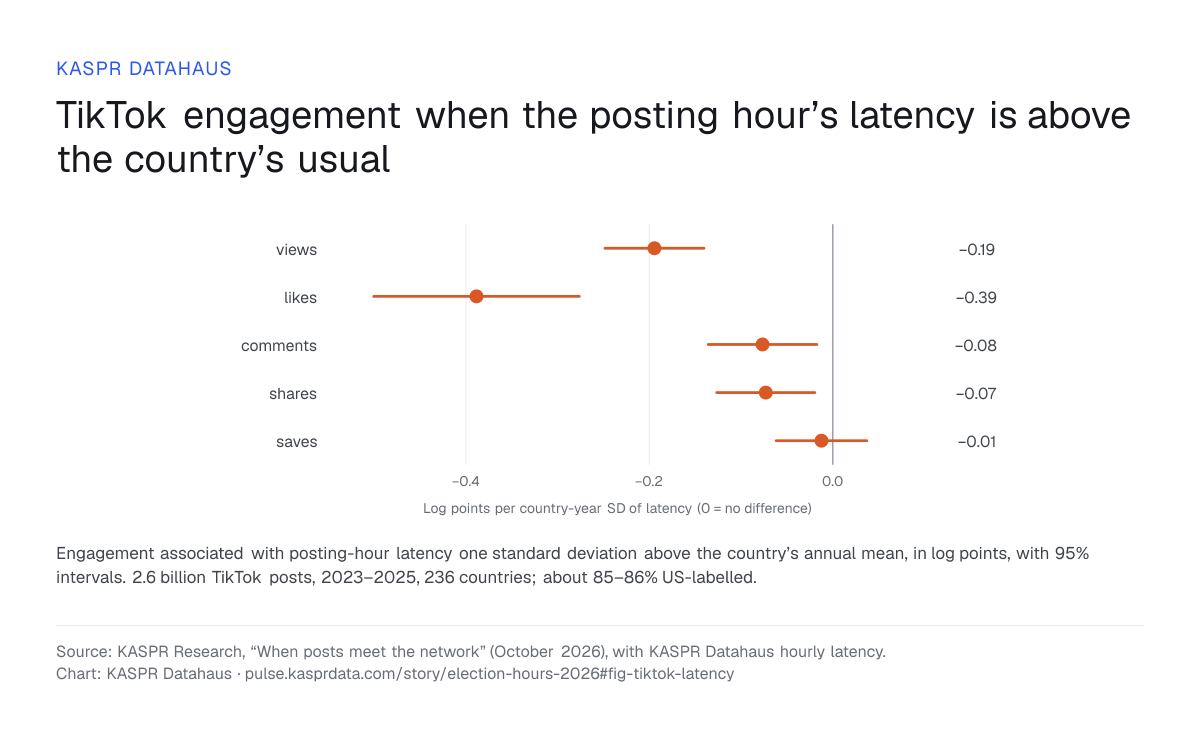
How well that video plays depends on the viewer’s network at that hour. When a county’s connections turn rough, video buffers, stalls and gets skipped, and a post that lands in a rough hour on Monday cannot be made up on Wednesday. KASPR’s study of 2.6 billion TikTok posts from 2023 to 2025 found that posting hours with higher national latency than a country’s usual go with lower engagement: one standard deviation above the country’s annual mean is associated with 0.19 log points lower views and 0.39 log points lower likes. The county figures in this story measure variability, the hour-to-hour swing in delay. In the study, variability moves the other way once latency is accounted for, so the two need separate reading. KASPR measures that roughness, hour by hour, for every county in the United States: the hour-to-hour change in latency and its variability, in milliseconds, from tens of thousands of responding addresses per county. The claim in this story is narrow. Engagement with video at a given hour depends on local network quality at that hour. Nothing in the data says who is watching, or who votes.
The pattern
Steady before six, rough from eight to ten, calmer again late
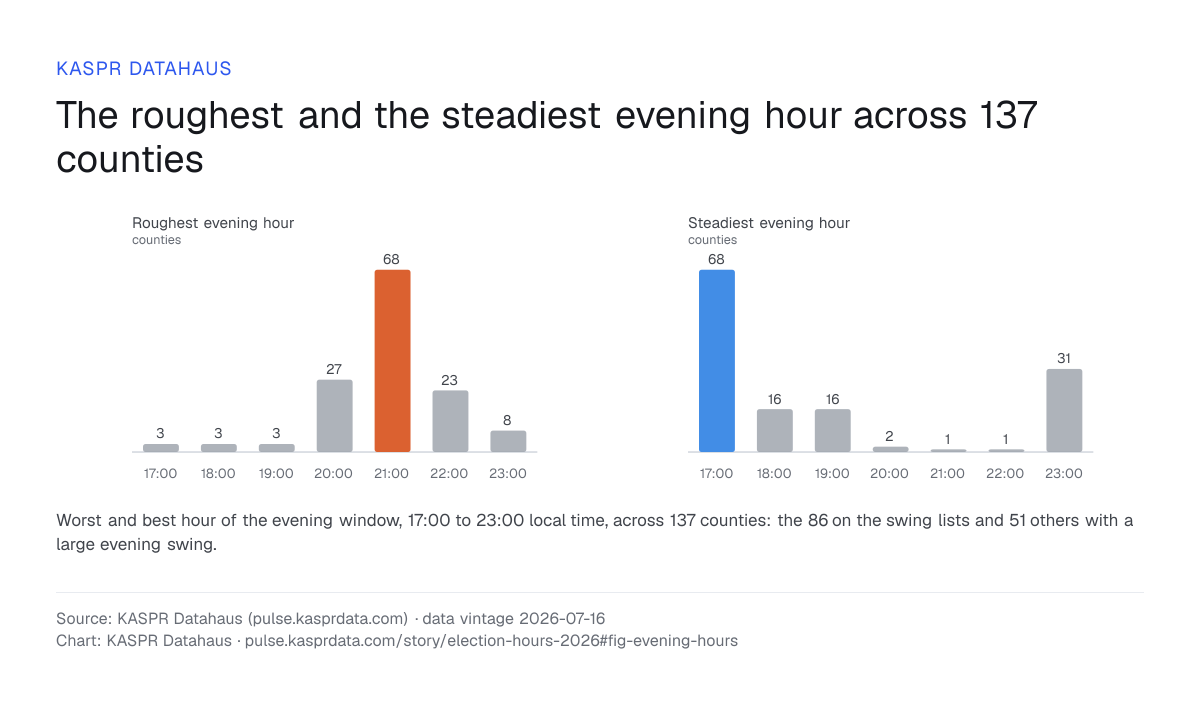
Across the 137 counties, 21:00 local time is the roughest evening hour in 68, 20:00 in 27 and 22:00 in 23. The steadiest hour is 17:00 in 68 counties and 23:00 in 31. The shape is the same almost everywhere: connections are at their steadiest before 18:00, roughest between 20:00 and 22:00, and settle again late in the evening. What the county decides is how far they swing.
The swing
In most counties the evening hour barely matters. In a few it matters a lot.
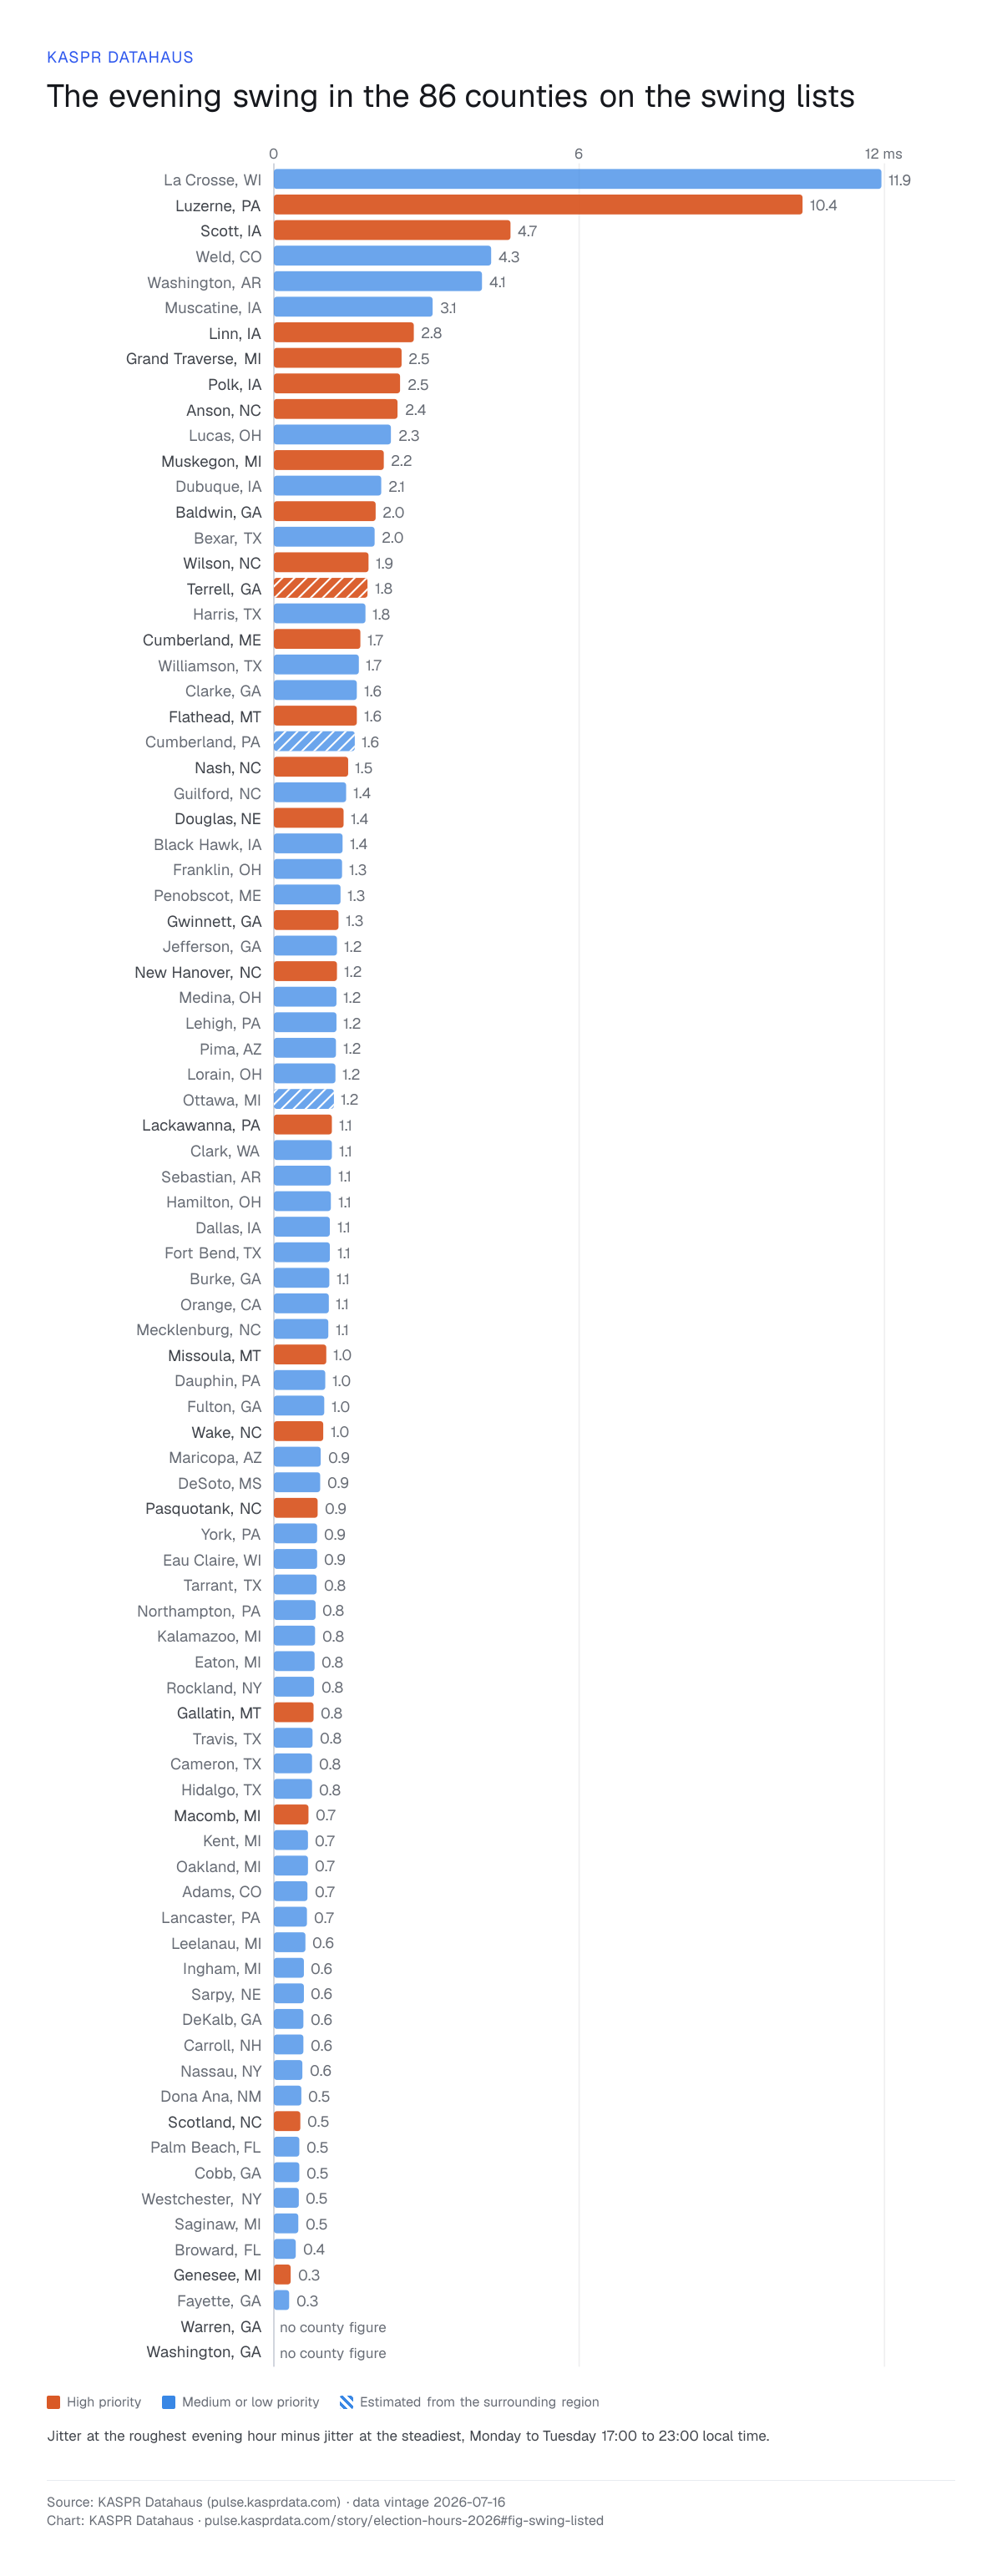
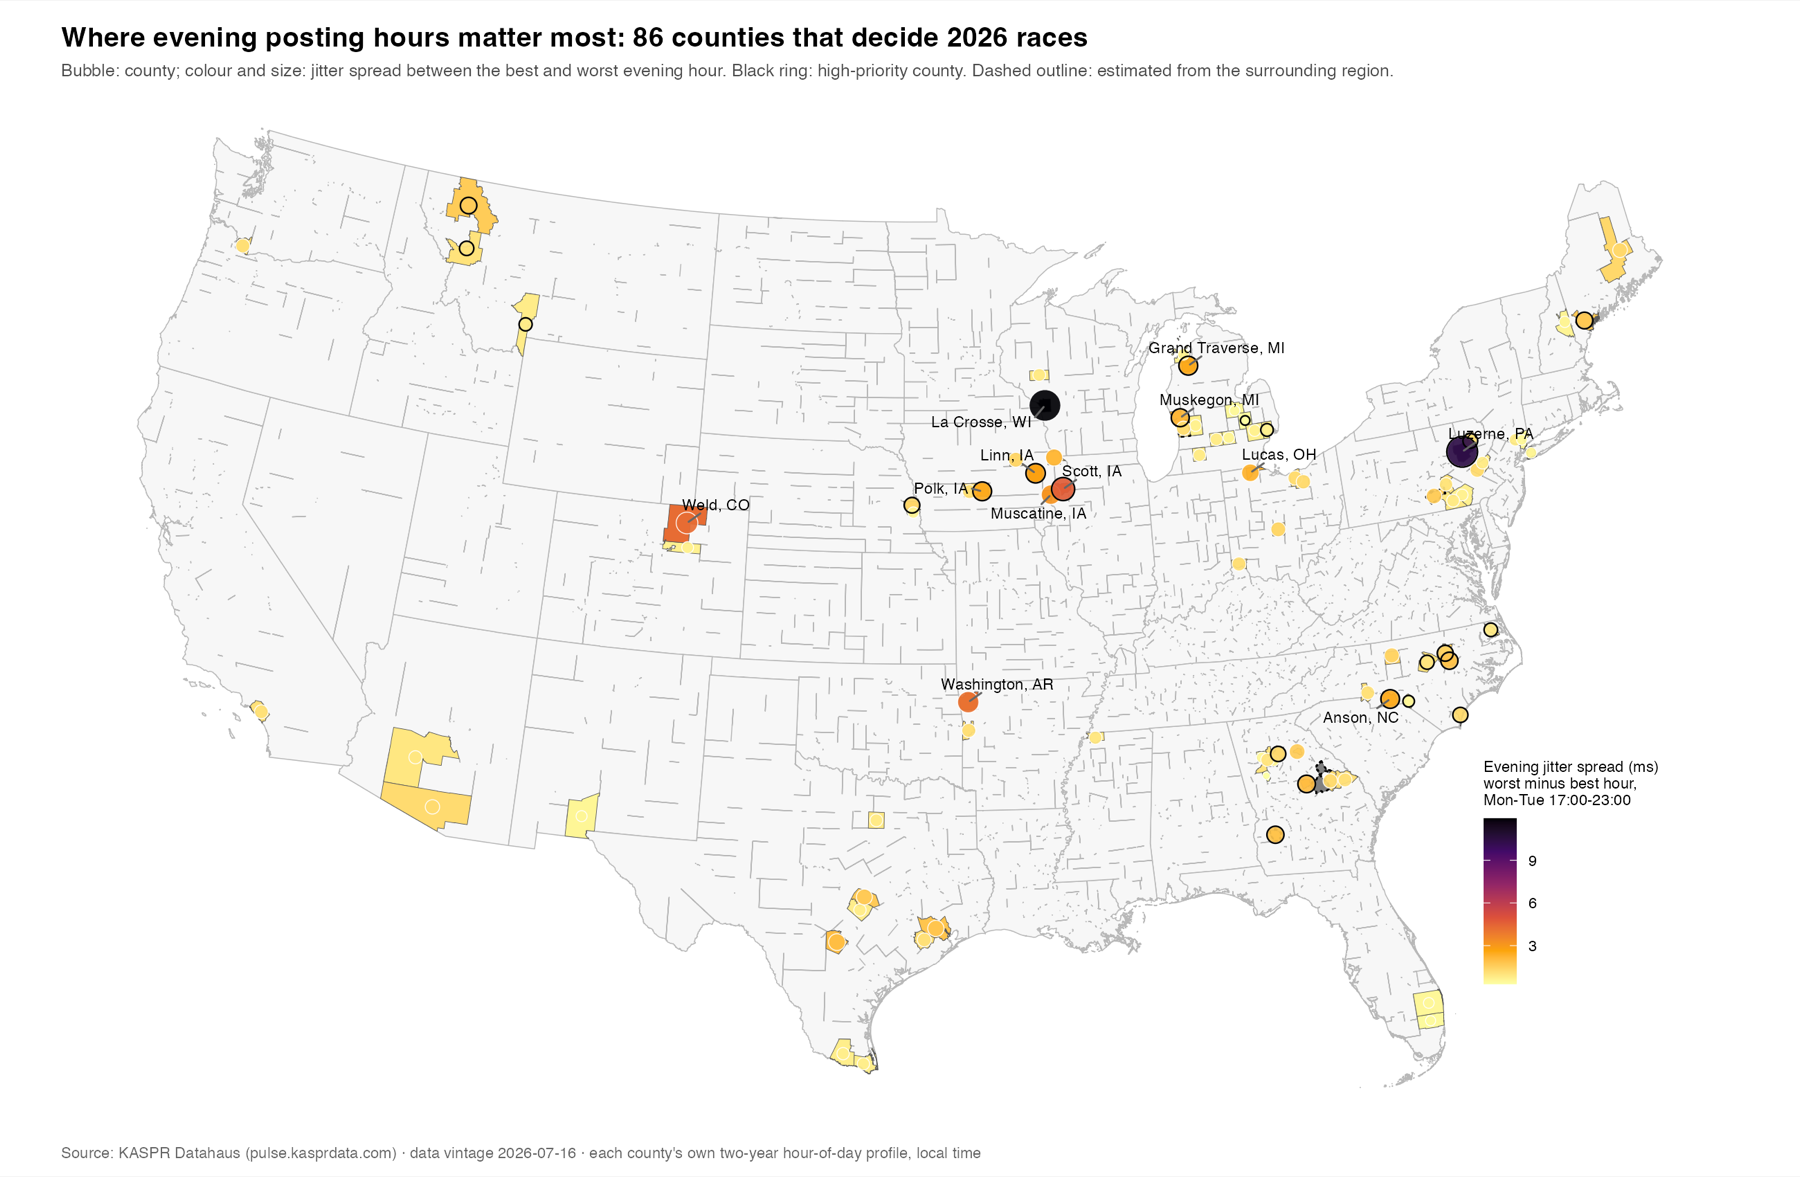
In Luzerne County, Pennsylvania, jitter runs 61.5 ms at 17:00 and 68.7 ms at 20:00 on an ordinary Monday: a swing of 10 ms, with latency 4.6 ms above the day’s floor at the rough end. La Crosse, Wisconsin swings 12 ms; Scott County, Iowa, 4.7 ms. Those are the exceptions. Across the 86 counties on the swing lists the median swing is 1.1 ms, and only 14 reach 2 ms. The largest metropolitan counties are flatter still: Los Angeles, Cook, Harris, King and Dallas all swing under 2 ms. The evening hour matters where networks are thinner, and it matters least where most people are.
Luzerne County, Pennsylvania, on a Monday
| Hour | Jitter | Chance of a rougher-than-usual hour |
|---|---|---|
| 17:00 | 61.5 | 0.59 |
| 20:00 | 68.7 | 0.99 |
| 21:00 | 68.1 | 0.99 |
| 23:00 | 58.3 | 0.20 |
Four of the seven evening hours; jitter in milliseconds.
The list
Twenty-six counties, their evenings
Luzerne, PA
10.4 ms
PA-8
Scott, IA
4.7 ms
IA-1; IA Senate
Linn, IA
2.8 ms
IA-2
Grand Traverse, MI
2.5 ms
MI Senate
Polk, IA
2.5 ms
IA-3; IA Senate
Anson, NC
2.4 ms
NC Senate
Muskegon, MI
2.2 ms
MI Senate
Baldwin, GA
2.0 ms
GA Senate
Wilson, NC
1.9 ms
NC Senate
Terrell, GA
1.8 ms
GA Senate
estimated from the surrounding region
Cumberland, ME
1.7 ms
ME Senate
Flathead, MT
1.6 ms
MT-1
Nash, NC
1.5 ms
NC Senate
Douglas, NE
1.4 ms
NE-2; NE Senate
Gwinnett, GA
1.3 ms
GA Senate
New Hanover, NC
1.2 ms
NC Senate
Lackawanna, PA
1.1 ms
PA-8
Missoula, MT
1.0 ms
MT-1
Wake, NC
1.0 ms
NC Senate
Pasquotank, NC
0.9 ms
NC Senate
Gallatin, MT
0.8 ms
MT-1
Macomb, MI
0.7 ms
MI-10; MI Senate
Scotland, NC
0.5 ms
NC Senate
Genesee, MI
0.3 ms
MI Senate
Warren, GA
GA Senate
estimated from the surrounding region
Washington, GA
GA Senate
estimated from the surrounding region
| County | Race | Best Monday hours | Roughest Monday hours | Tuesday hours before polls close | Polls close |
|---|---|---|---|---|---|
| Luzerne, PA | PA-8 | 23:00, 17:00, 18:00 | 20:00, 21:00, 19:00 | 17:00, 18:00, 19:00 | 20:00 |
| Scott, IA | IA-1; IA Senate | 17:00, 23:00, 18:00 | 21:00, 20:00, 19:00 | 17:00, 18:00, 19:00 | 20:00 |
| Linn, IA | IA-2 | 17:00, 18:00, 19:00 | 20:00, 22:00, 23:00 | 17:00, 18:00, 19:00 | 20:00 |
| Grand Traverse, MI | MI Senate | 18:00, 17:00, 19:00 | 21:00, 20:00, 22:00 | 18:00, 17:00, 19:00 | 20:00 |
| Polk, IA | IA-3; IA Senate | 17:00, 18:00, 19:00 | 21:00, 20:00, 22:00 | 17:00, 18:00, 19:00 | 20:00 |
| Anson, NC | NC Senate | 18:00, 17:00, 19:00 | 22:00, 21:00, 20:00 | 18:00, 17:00 | 19:30 |
| Muskegon, MI | MI Senate | 17:00, 18:00, 19:00 | 22:00, 21:00, 23:00 | 17:00, 18:00, 19:00 | 20:00 |
| Baldwin, GA | GA Senate | 18:00, 17:00, 19:00 | 22:00, 21:00, 23:00 | 18:00, 17:00 | 19:00 |
| Wilson, NC | NC Senate | 23:00, 18:00, 19:00 | 21:00, 17:00, 20:00 | 18:00, 17:00 | 19:30 |
| Terrell, GAestimated | GA Senate | 17:00, 18:00, 19:00 | 21:00, 22:00, 23:00 | 17:00, 18:00 | 19:00 |
| Cumberland, ME | ME Senate | 23:00, 17:00, 22:00 | 20:00, 21:00, 19:00 | 17:00, 18:00, 19:00 | 20:00 |
| Flathead, MT | MT-1 | 17:00, 23:00, 22:00 | 21:00, 20:00, 19:00 | 17:00, 18:00, 19:00 | 20:00 |
| Nash, NC | NC Senate | 17:00, 23:00, 19:00 | 21:00, 20:00, 22:00 | 17:00, 18:00 | 19:30 |
| Douglas, NE | NE-2; NE Senate | 17:00, 18:00, 19:00 | 21:00, 20:00, 23:00 | 17:00, 18:00, 19:00 | 20:00 |
| Gwinnett, GA | GA Senate | 18:00, 22:00, 19:00 | 17:00, 23:00, 21:00 | 18:00, 17:00 | 19:00 |
| New Hanover, NC | NC Senate | 23:00, 17:00, 18:00 | 21:00, 20:00, 22:00 | 17:00, 18:00 | 19:30 |
| Lackawanna, PA | PA-8 | 23:00, 17:00, 18:00 | 20:00, 21:00, 22:00 | 17:00, 18:00, 19:00 | 20:00 |
| Missoula, MT | MT-1 | 23:00, 22:00, 20:00 | 18:00, 19:00, 17:00 | 17:00, 19:00, 18:00 | 20:00 |
| Wake, NC | NC Senate | 18:00, 17:00, 19:00 | 21:00, 20:00, 22:00 | 18:00, 17:00 | 19:30 |
| Pasquotank, NC | NC Senate | 23:00, 19:00, 22:00 | 18:00, 20:00, 21:00 | 17:00, 18:00 | 19:30 |
| Gallatin, MT | MT-1 | 17:00, 18:00, 21:00 | 19:00, 22:00, 23:00 | 17:00, 18:00, 19:00 | 20:00 |
| Macomb, MI | MI-10; MI Senate | 19:00, 18:00, 23:00 | 21:00, 22:00, 20:00 | 19:00, 18:00, 17:00 | 20:00 |
| Scotland, NC | NC Senate | 18:00, 23:00, 20:00 | 21:00, 19:00, 22:00 | 18:00, 17:00 | 19:30 |
| Genesee, MI | MI Senate | 20:00, 19:00, 23:00 | 22:00, 21:00, 17:00 | 19:00, 18:00, 17:00 | 20:00 |
| Warren, GAestimated | GA Senate | — | — | — | 19:00 |
| Washington, GAestimated | GA Senate | — | — | — | 19:00 |
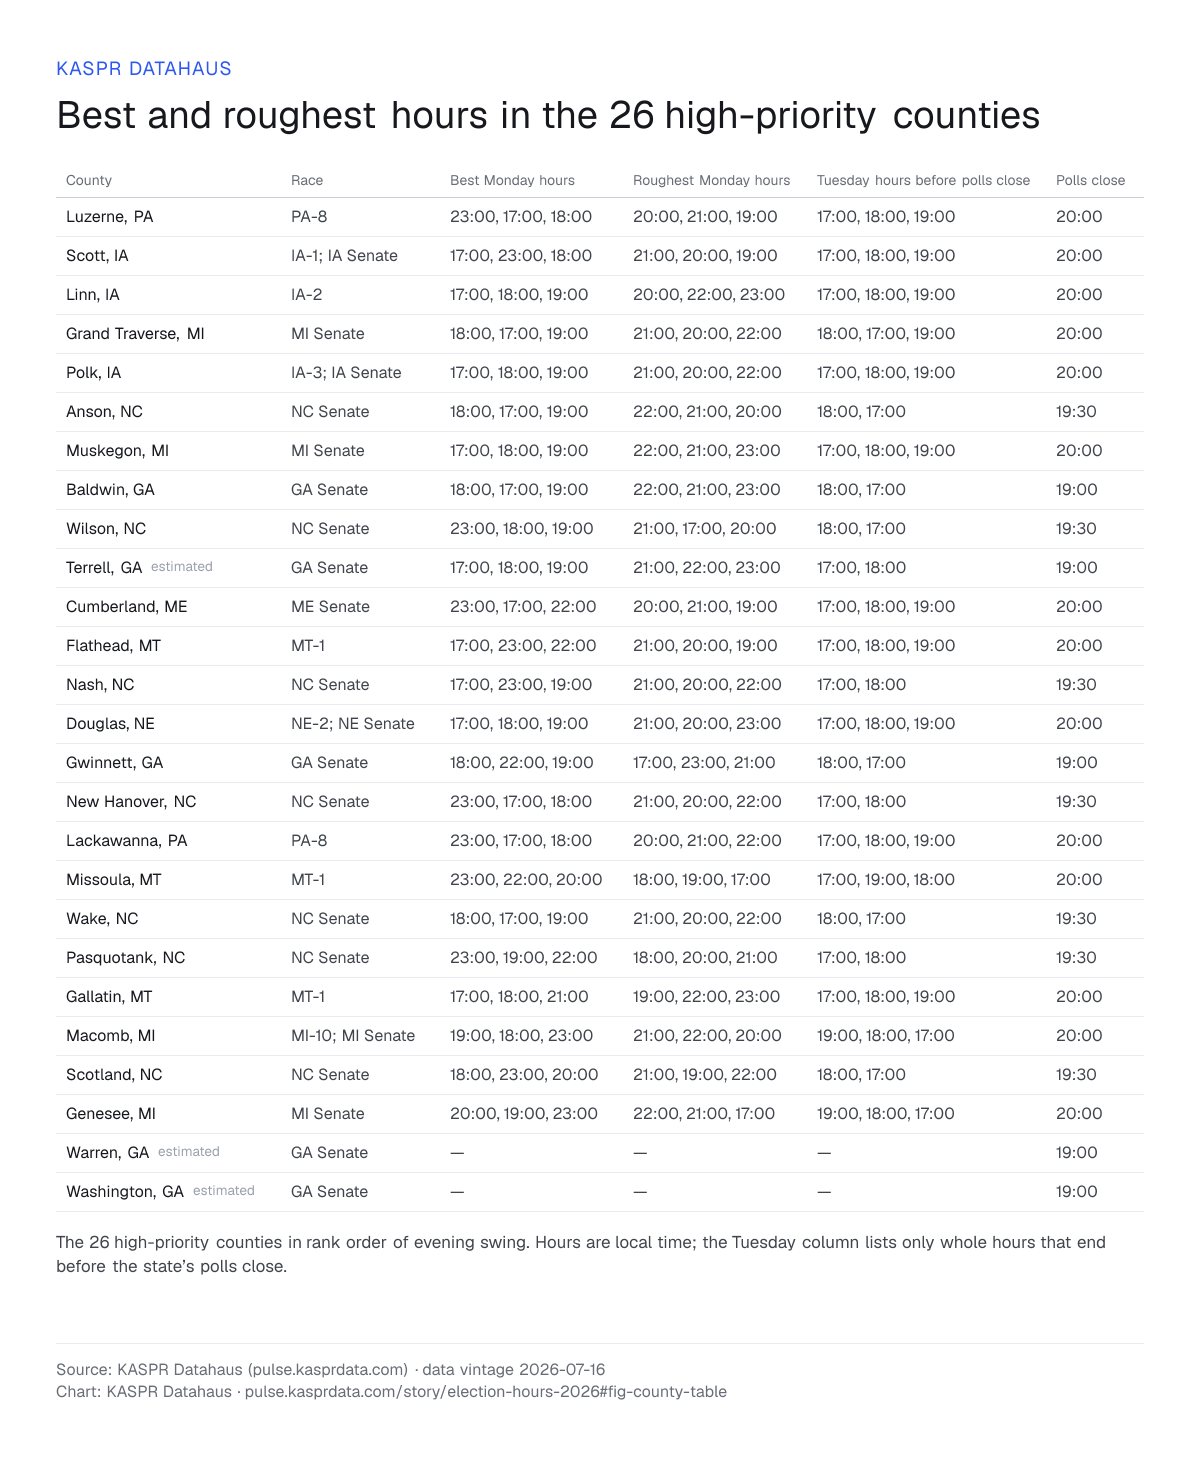
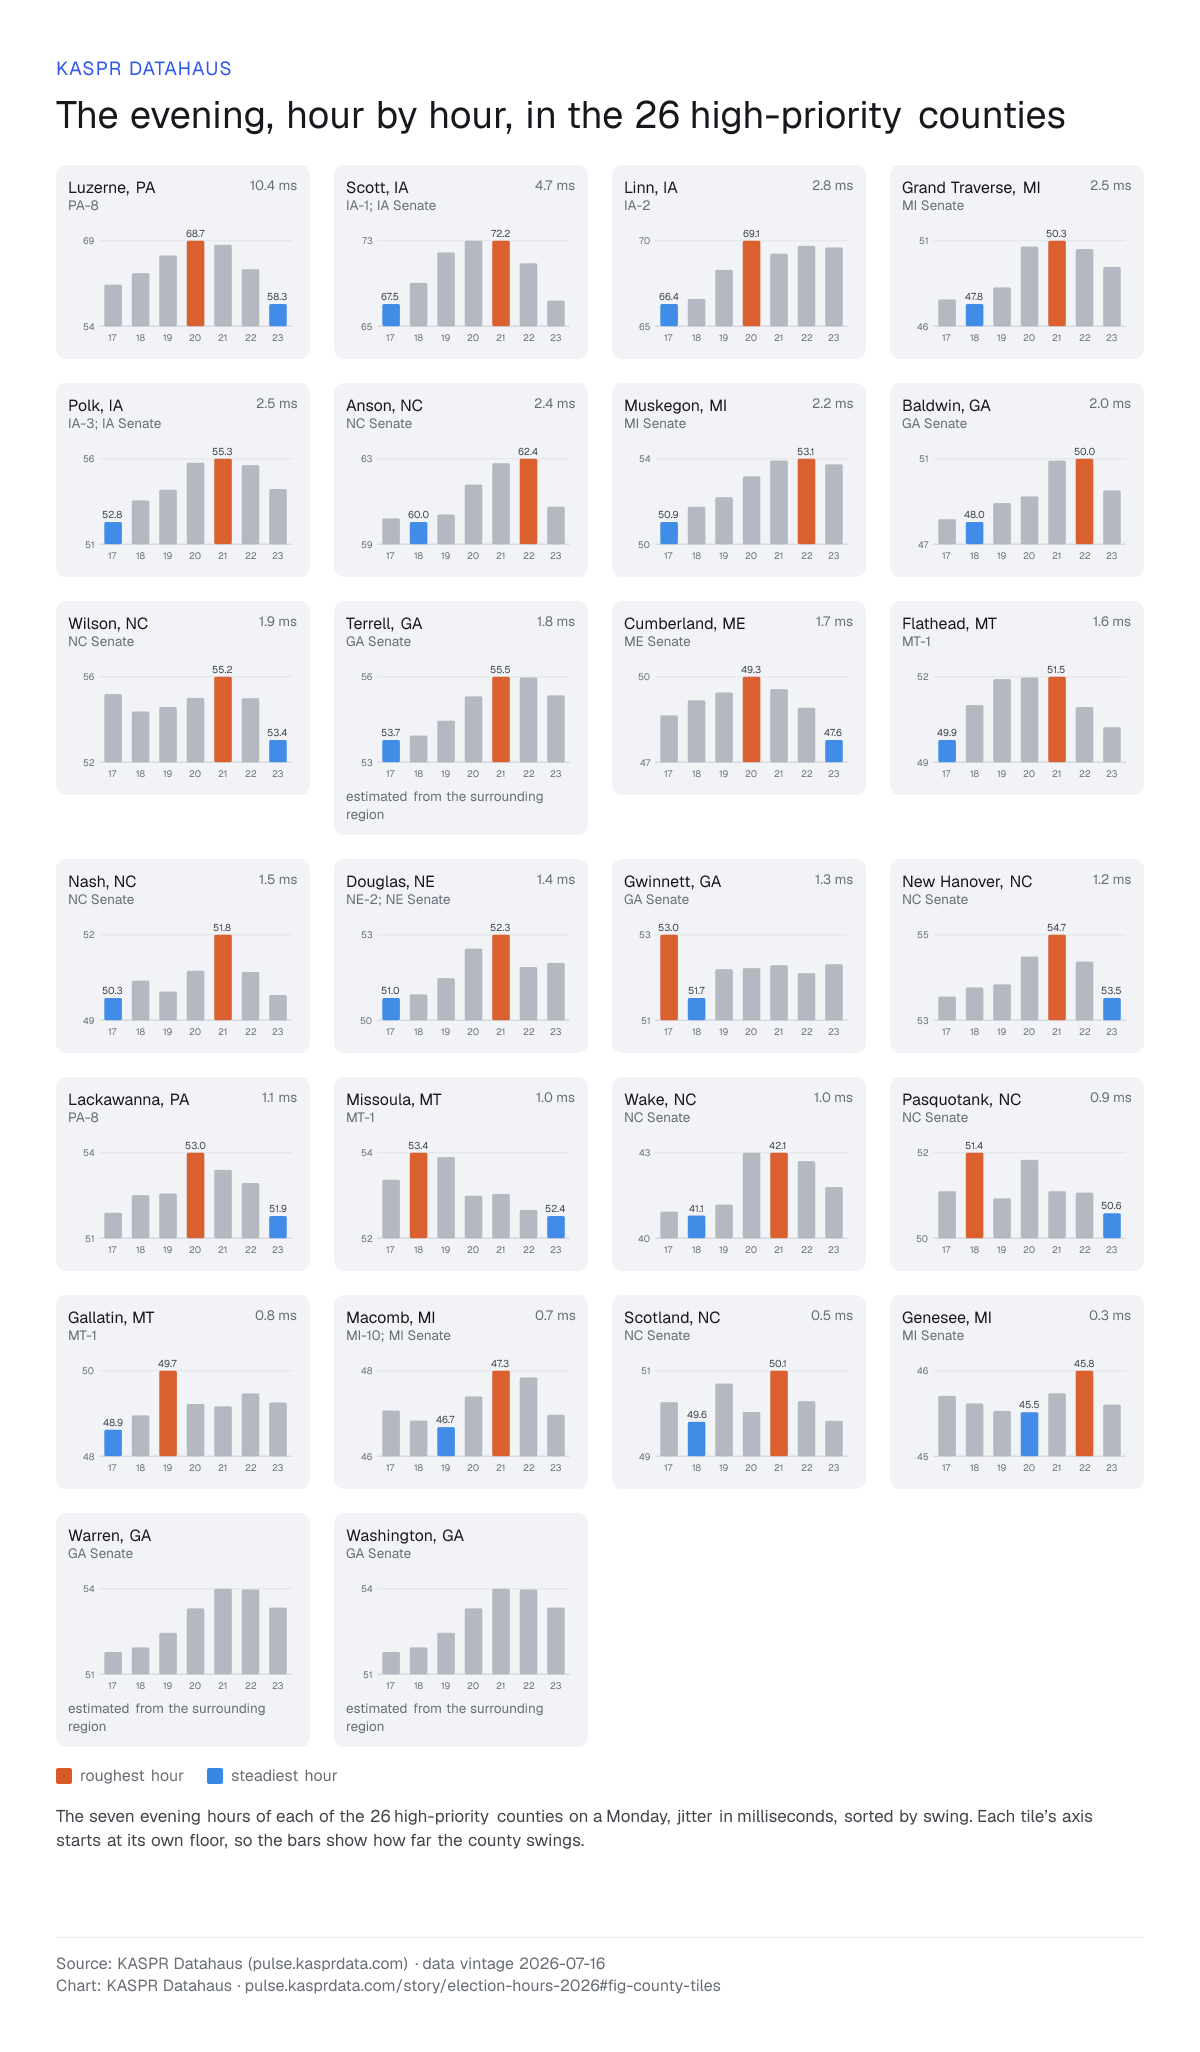
Monday 2 November is the last full evening. On Tuesday, polls close at 19:00 in Georgia, 19:30 in North Carolina and 20:00 in Pennsylvania, Michigan, Iowa, Nebraska, Maine and Montana, so only whole hours that end before closing count. In most of these counties that leaves 17:00 and 18:00; in the 20:00 states, 19:00 as well. Three Georgia counties on the list, Terrell, Warren and Washington, have too few addresses of their own for a county figure in the evening; their values come from the surrounding region and are marked.
Elsewhere
Where the evening swing is largest
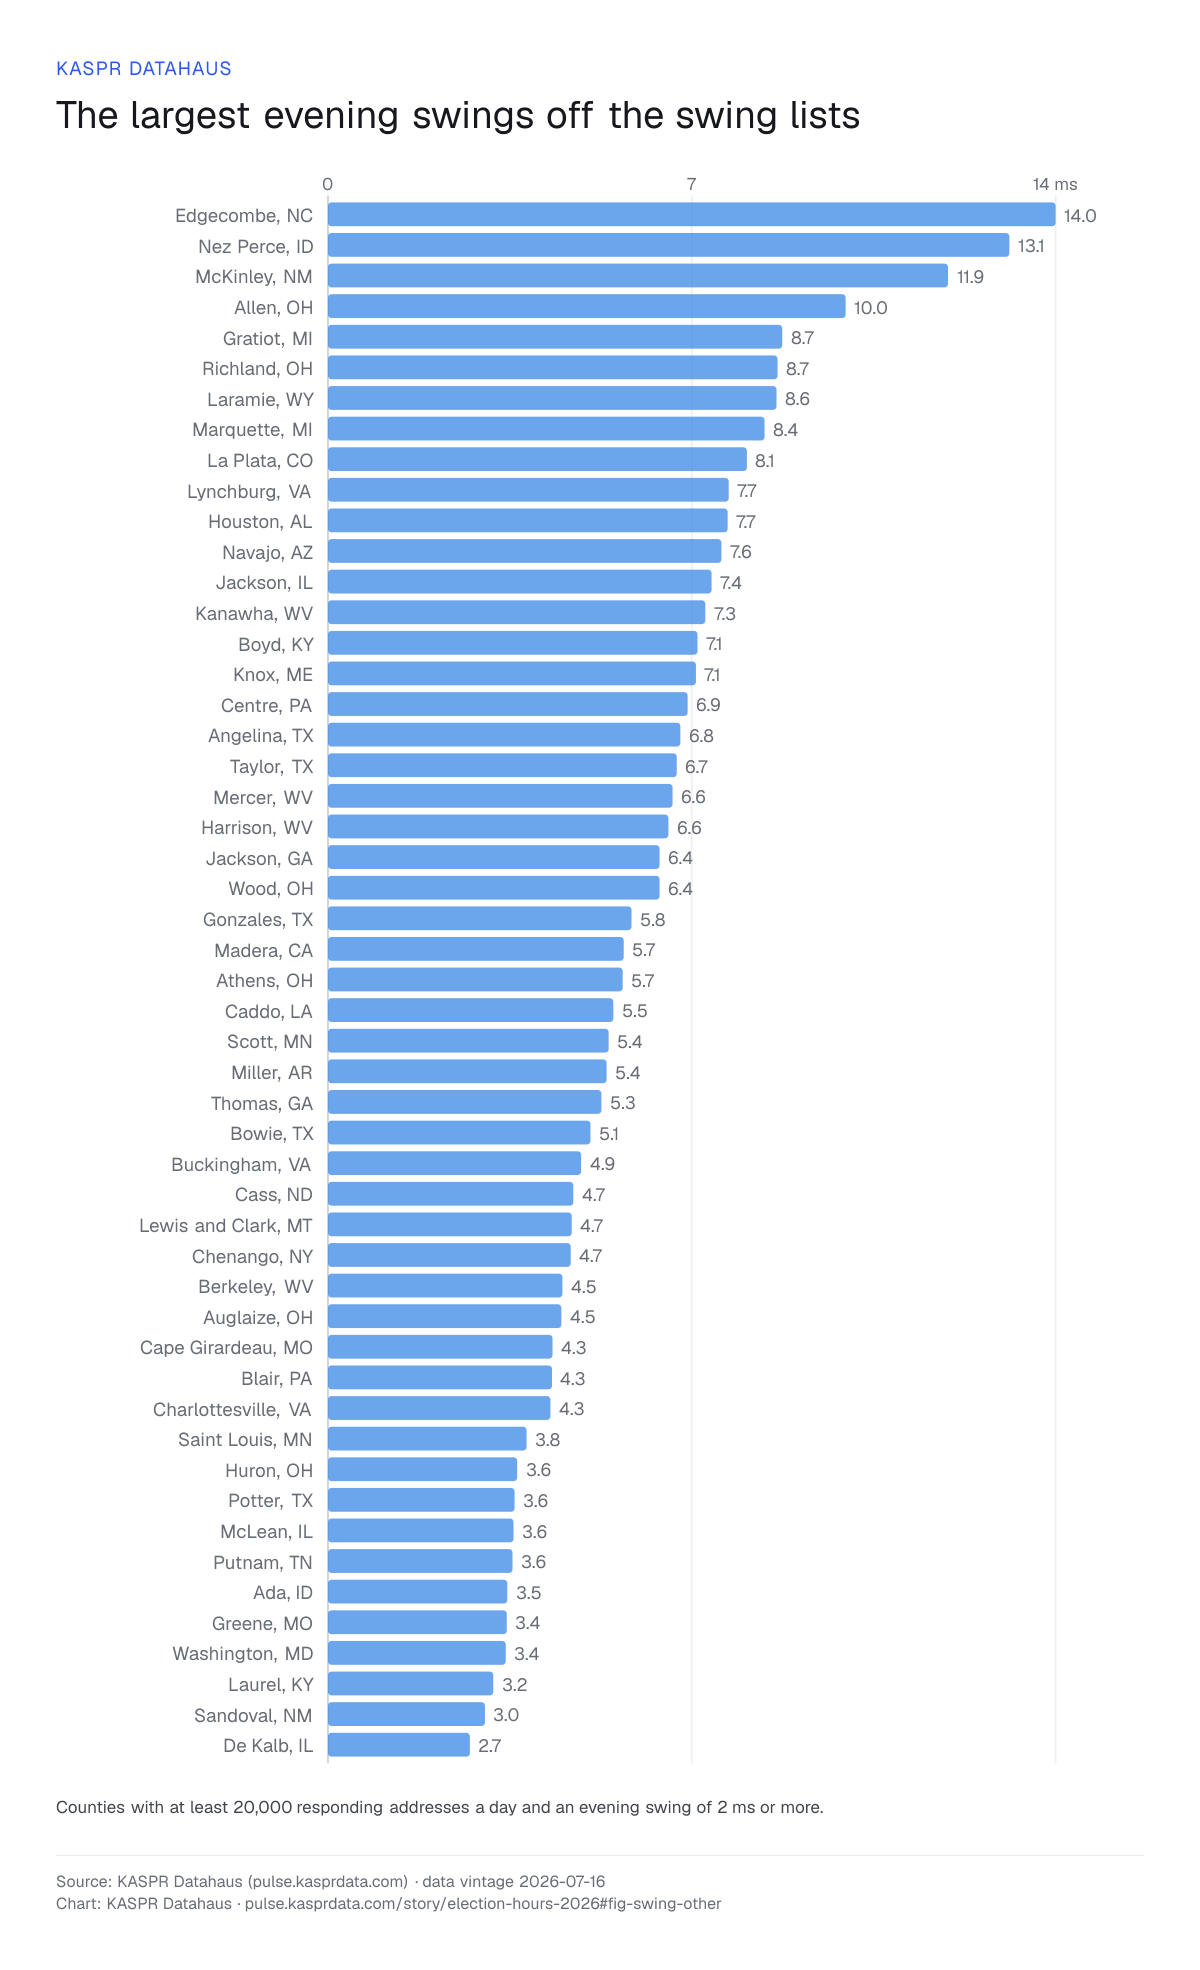
None of these counties is on a swing list, and all of them swing more than most that are. Edgecombe, North Carolina swings 14 ms between its best and worst evening hour; Nez Perce, Idaho 13 ms; McKinley, New Mexico 12 ms; Allen and Richland in Ohio, Gratiot and Marquette in Michigan, and Laramie, Wyoming between 8 and 10 ms. Appalachia, the Navajo Nation, and small cities with a university or a state capital recur. Wherever a campaign, a newsroom or a creator posts video in these counties, the hour is worth choosing.
The map
Act on it
Pick the hour for your place
The best hour for any place.
KASPR Schedule gives the steadiest hour for any town or district, in local time, free.
Check a post you already made.
Rewind replays the hour a post went out against the network at that hour, and shows the hours that would have been steadier.
Your own locations.
Field offices, call centres, polling-day volunteers: add your locations and see each one’s district, grade and rough hours.
The research behind the hour: “When posts meet the network”, on how posting time and national network conditions relate to engagement across 2.6 billion TikTok posts. Read “When posts meet the network”
How this was measured
KASPR measures round-trip time to a fixed KASPR server from responding internet addresses in each county, many times an hour, and summarises the hour-to-hour change in latency and its variability (jitter) in milliseconds; the absolute latency level is a distance to KASPR’s server, so only the within-day change is reported. The 137 counties contribute a median of about 45,000 responding addresses a day each (from 73 in Terrell GA to 129,000), and five counties with too few addresses of their own for some evening hours (Terrell, Warren and Washington GA, Cumberland PA, Ottawa MI) take those hours from the surrounding region and are marked as estimated. Each county’s hour-of-day profile is built from two years of measurements, 16 July 2024 to 16 July 2026, with at least 150 observed hours behind every hour of the day, expressed in the county’s local time and scaled to the county’s level in the two weeks to 16 July 2026. The best and worst hours cover the evening window of 17:00 to 23:00 on Monday 2 and Tuesday 3 November, which share one profile because it is by hour of day, and on Tuesday only whole hours that end before the state’s polls close are ranked. The data records when a network is rougher than usual and by how much, not why, and it says nothing about who is online, what they watch, or whether anyone votes.
Where KASPR stands
KASPR sells timing to any campaign, political action committee, nonprofit, newsroom or creator, on the same terms and at the same price. This story names races and counties because that is where the networks are; it names no candidate, no party and no preferred outcome, and KASPR takes none.
KASPR holds no voter data and no personal data. It measures networks, not people: the figures describe how an internet connection in a county usually behaves at a given hour, aggregated from many addresses, with no individual identifiable. Nothing here claims that network timing changes turnout. The claim is narrower: how well video plays at a given hour depends on local network quality at that hour, and mobilisation content has a deadline.
Sources
- County lists: Inside Elections (19 Senate swing counties); Newsweek, “100 counties”; Cook Political Report, House race ratings.
- Poll-closing times: The Green Papers, 2026 General Election polling hours, local time.
- Measurement: KASPR Datahaus, data vintage 2026-07-16.
- The Washington Post, “A guide to the key battleground House races this November”, 6 September 2026.
- Reuters Institute for the Study of Journalism, Digital News Report 2025: United States.
- Digiday, “Why the 2026 midterms could mark a turning point for influencers in political campaigns”, 29 October 2026.
Source: KASPR Datahaus (pulse.kasprdata.com) · data vintage 2026-07-16
Questions and answers
- Which evening hour has the roughest internet connections in the US counties that decide the 2026 races?
- Across the 137 counties KASPR measured, 21:00 local time is the roughest evening hour in 68, 20:00 in 27 and 22:00 in 23. Connections are steadiest early in the evening: 17:00 is the steadiest hour in 68 counties. The figures cover 17:00 to 23:00 on Monday 2 and Tuesday 3 November 2026, from data vintage 2026-07-16.
- How much does network quality swing between the best and worst evening hour?
- In Luzerne County, Pennsylvania, jitter runs 61.5 ms at 17:00 and 68.7 ms at 20:00 on an ordinary Monday, and the swing between its steadiest and roughest evening hour is 10 ms. Luzerne is an exception. Across the 86 counties on the swing lists the median swing is 1.1 ms, and only 14 reach 2 ms.
- Where is the evening swing in network quality largest?
- In counties off the swing lists. Edgecombe, North Carolina swings 14 ms between its best and worst evening hour, Nez Perce, Idaho 13 ms and McKinley, New Mexico 12 ms. The largest metropolitan counties are flatter: Los Angeles, Cook, Harris, King and Dallas all swing under 2 ms.
- Which hours on election day come before the polls close?
- On Tuesday 3 November 2026, polls close at 19:00 in Georgia, 19:30 in North Carolina and 20:00 in Pennsylvania, Michigan, Iowa, Nebraska, Maine and Montana. Only whole hours that end before closing are ranked. In most of the high-priority counties that leaves 17:00 and 18:00, and in the 20:00 states 19:00 as well.
- How did KASPR measure each county’s evening?
- KASPR measures round-trip time from responding internet addresses in each county to a fixed KASPR server, many times an hour, and reports the hour-to-hour change in latency and jitter in milliseconds. The 137 counties contribute a median of about 45,000 responding addresses a day each. Each county’s hour-of-day profile comes from two years of measurements, 16 July 2024 to 16 July 2026, in local time. The data describes networks and holds nothing on who is online, what they watch or whether anyone votes.