
KASPR Research · October 2026
When posts meet the network
A country’s own normal
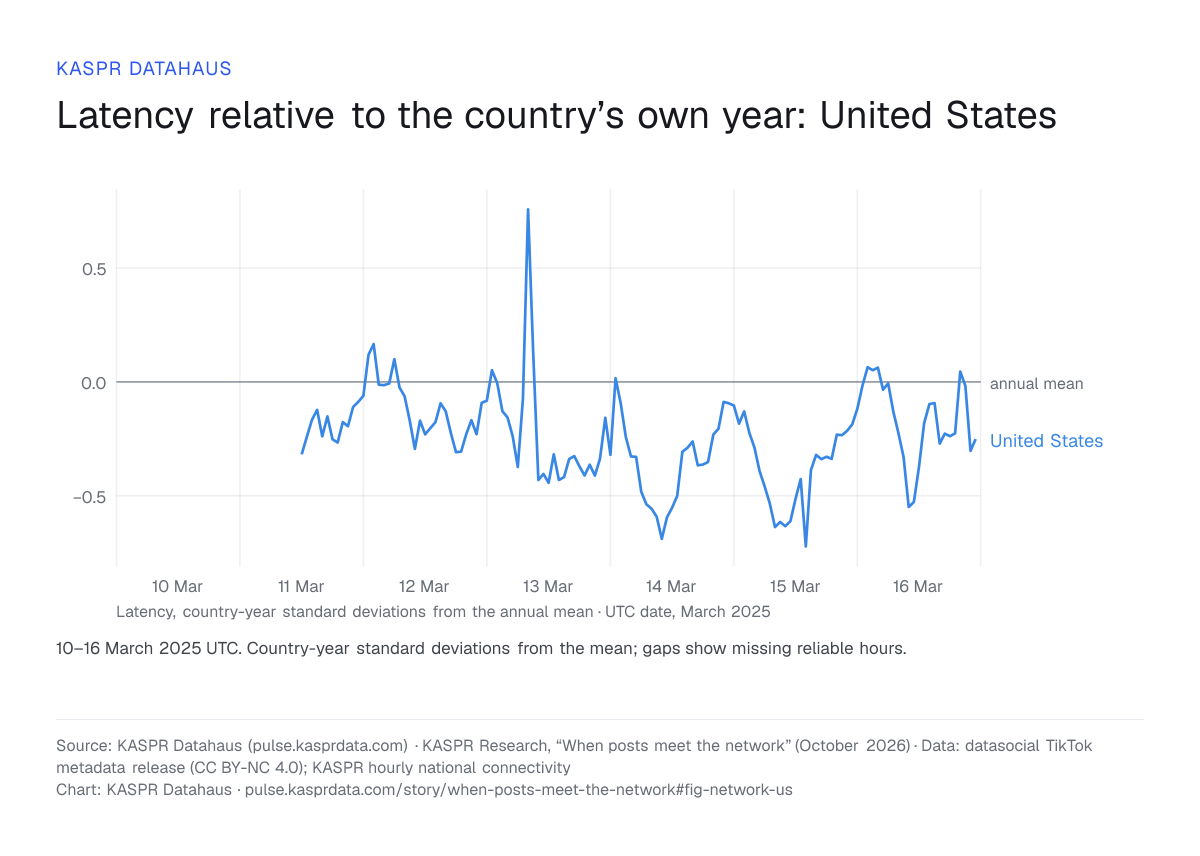
National latency measures how long external probes take to receive a response. It differs across countries. We express latency and jitter relative to each country’s own year: zero is its annual mean, and one is one annual standard deviation above it. The illustration shows a week in March 2025, with missing reliable hours left as gaps.
The same scale across markets
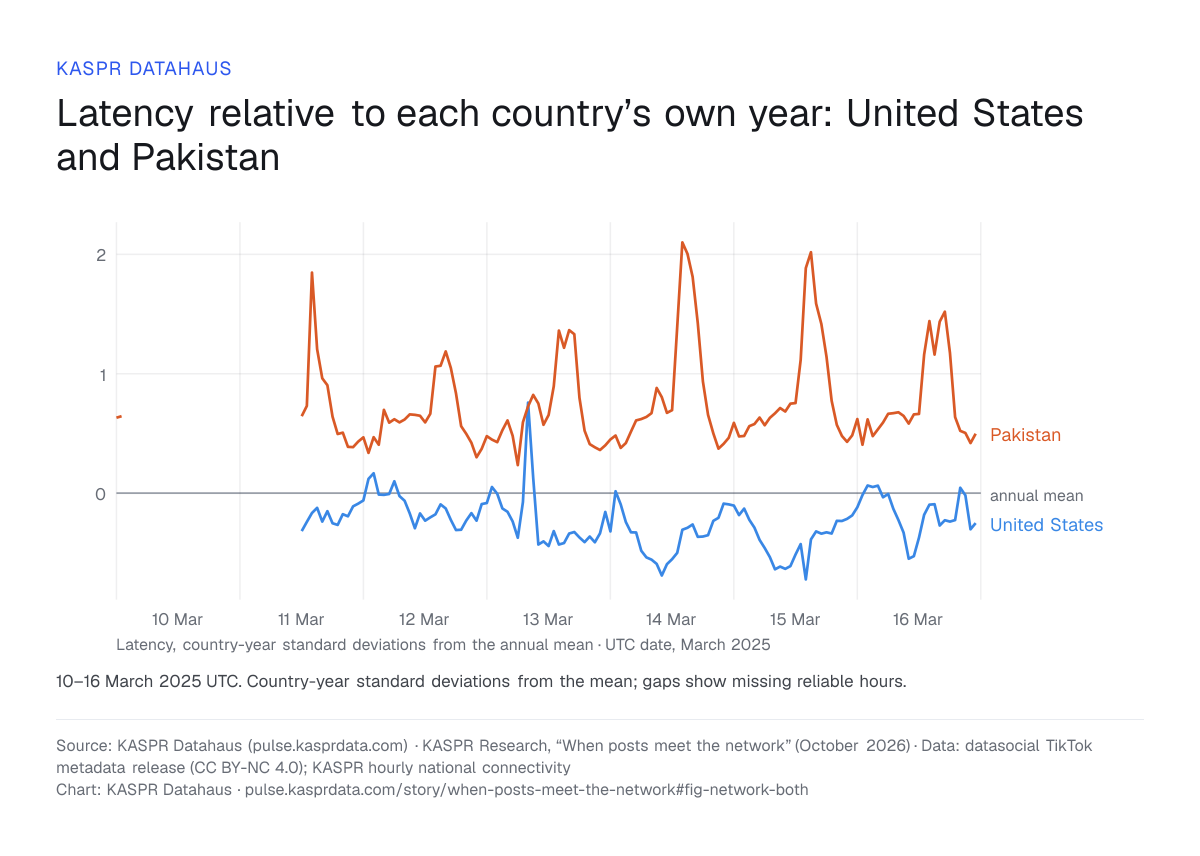
Adding Pakistan shows how conditions move relative to its own annual baseline. A one-standard-deviation change has the same relative interpretation in both countries, although the corresponding number of milliseconds differs. These national probe measurements describe aggregate network conditions; individual viewers may experience different connections.
A modest engagement association
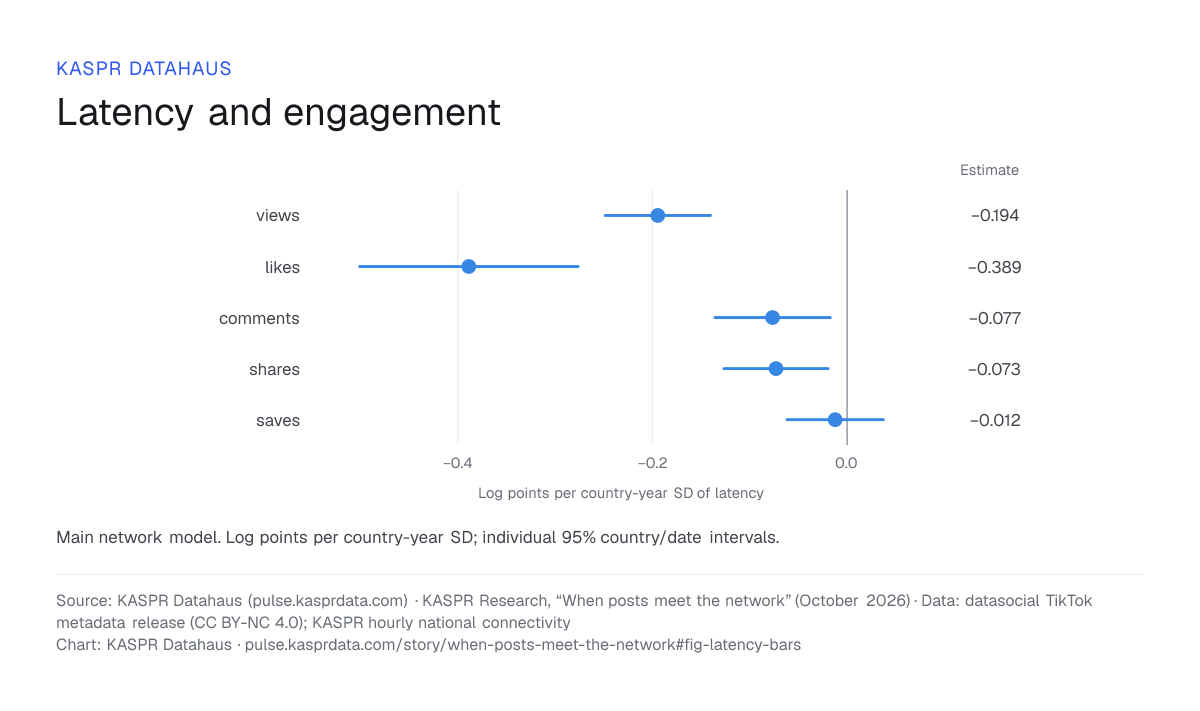
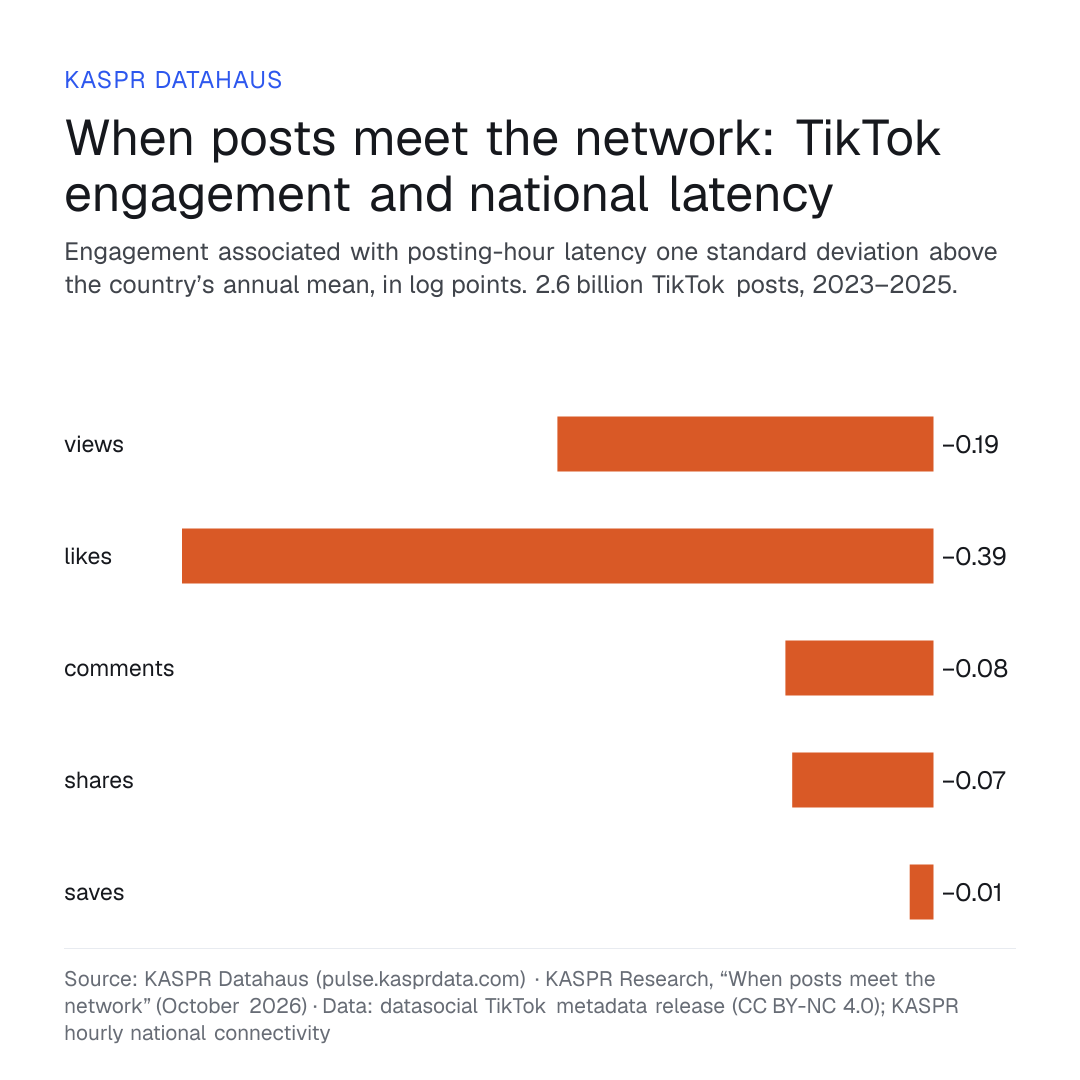
In the main model, a one-standard-deviation increase in latency is associated with 0.389 log points lower likes and 0.073 log points lower shares. Views and comments also have negative estimates; saves is less precisely estimated. Each coefficient compares posting hours after accounting for country-specific daily conditions, recurring local weekly patterns, post characteristics and snapshot age. These are log points for log(1+counts), rather than percentage changes in average counts.
Latency and variability tell different stories
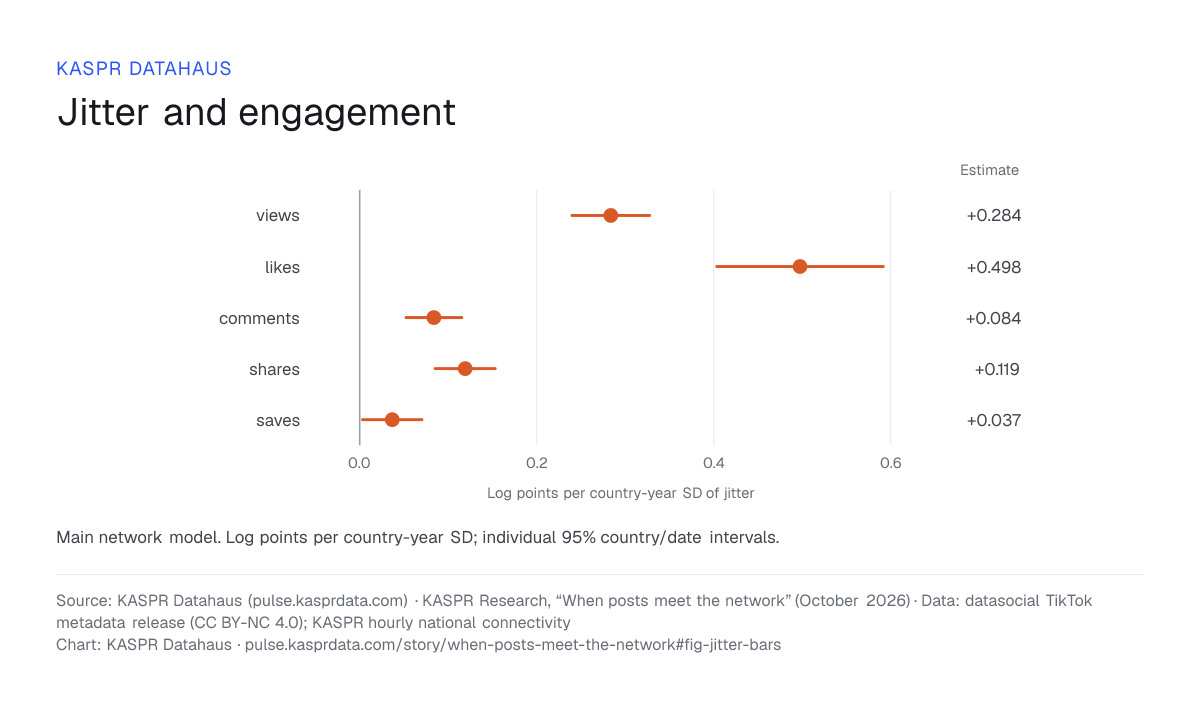
Jitter measures variability in probe round-trip times. Its association with engagement is positive when latency is included in the same model. Latency and jitter therefore need separate interpretation. Their signs describe conditional relationships in these data; the study does not reduce network quality to a single score.
Where the evidence is strongest
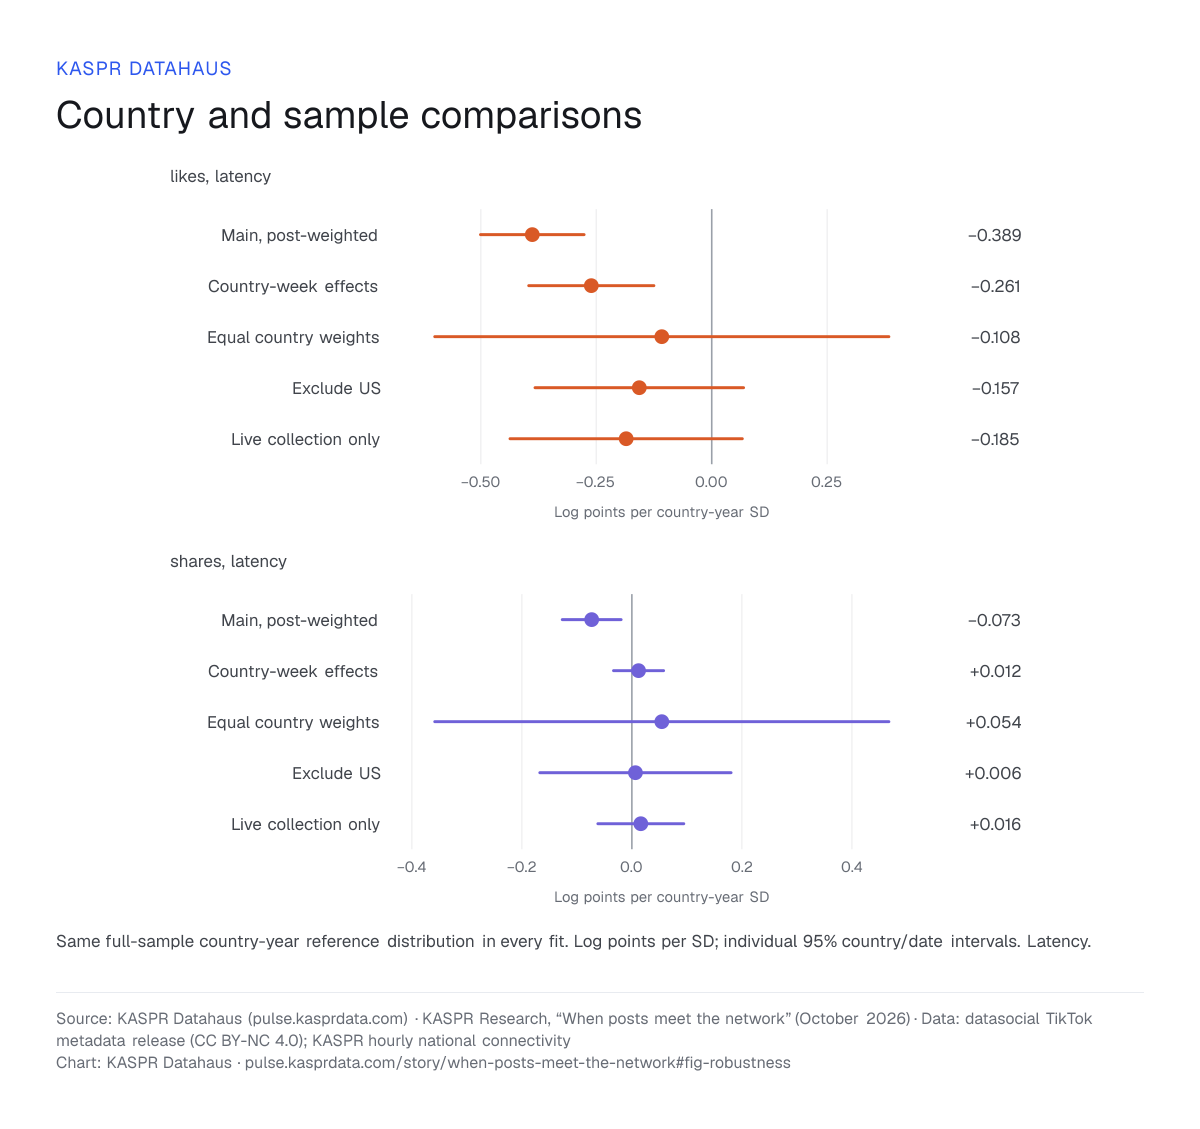
The US-centred composition matters for generalisability. Equal-country weighting and removing the US produce less precise estimates for likes and shares. Likes has stronger support across the reported checks, while shares is more sensitive to the specification. The pooled results are most informative about the collection’s largest market; the comparisons show the uncertainty around extending them to other settings.
likes, latency
shares, latency
The shape adds context
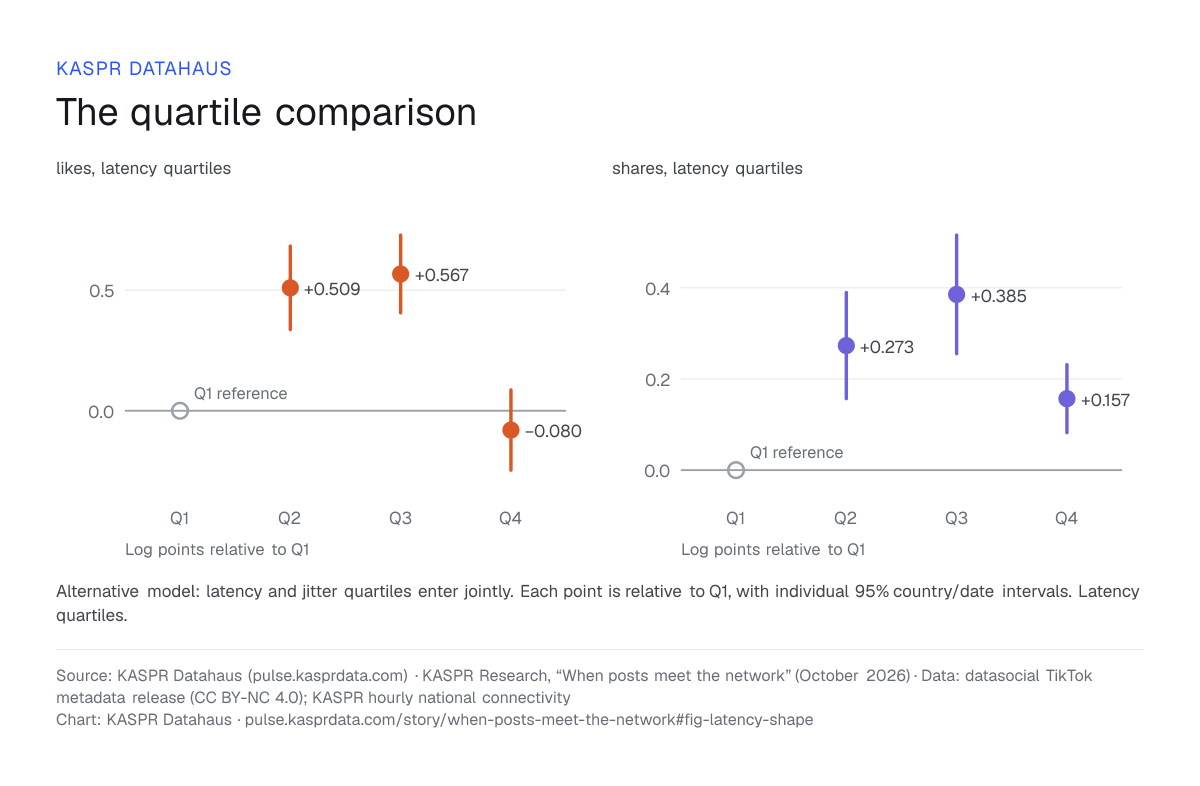
Grouping hours into country-year quartiles gives a complementary view. The pattern for likes is not uniformly decreasing, and shares are higher in the highest-latency quartile than in the lowest. These are alternative-model comparisons, with latency and jitter both entered as quartile indicators. The paper retains these patterns alongside levels, logarithms, clipped measures and worst-decile indicators.
likes, latency quartiles
shares, latency quartiles
A rhythm across the day
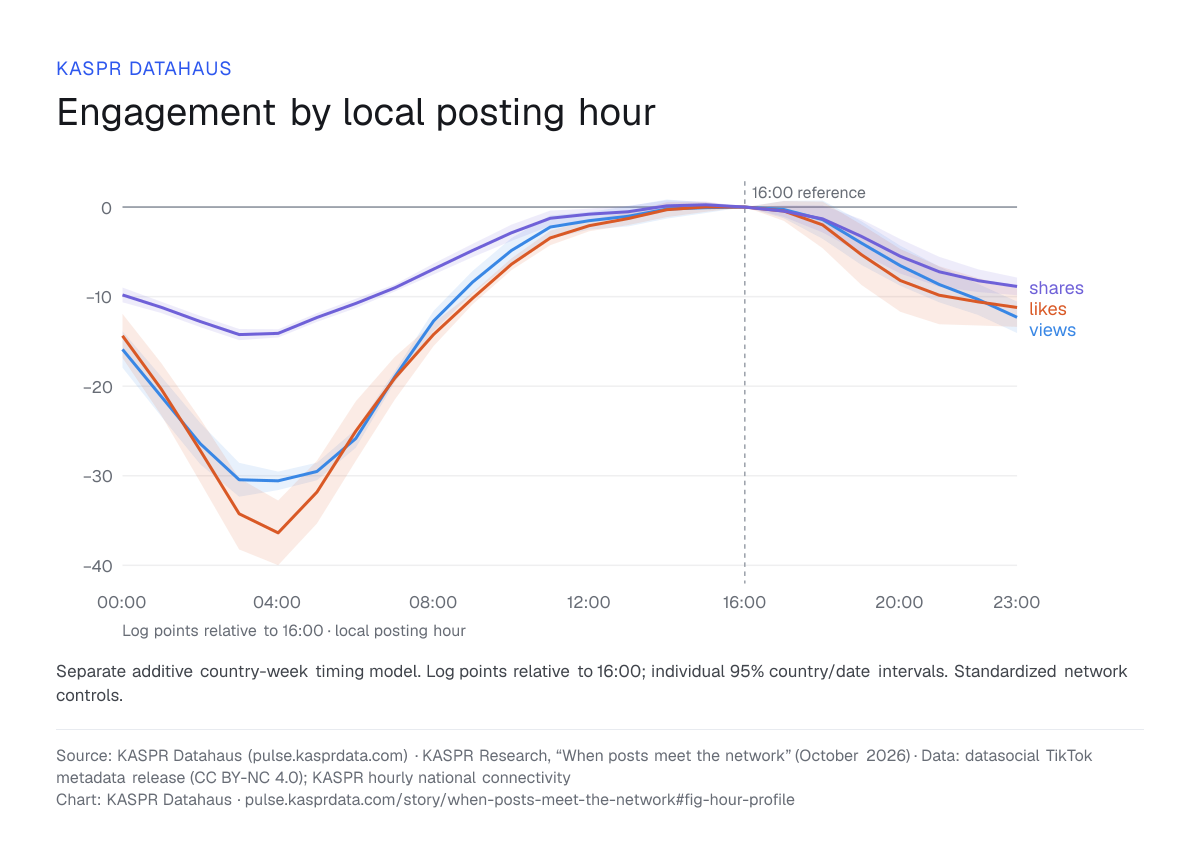
A separate descriptive model compares posts published at different local hours. It includes country-by-calendar-week effects, weekday indicators and the same standardized network and post controls. The curves show fitted differences relative to 16:00. They describe the mix of posts and audiences observed at each hour; they do not estimate the gain from moving the same post.
The weekday component
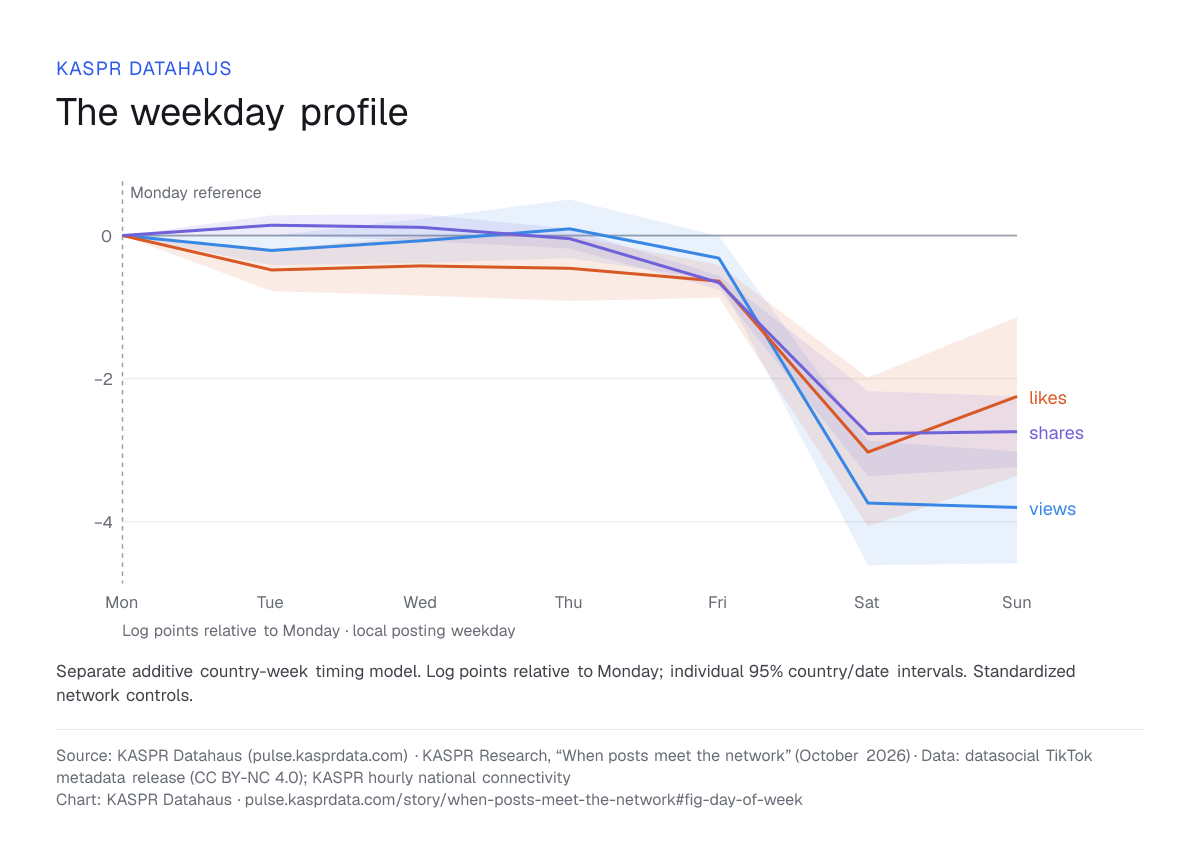
The weekday profile uses Monday as its reference. Hour and weekday effects are additive in this model. An afternoon difference therefore has the same fitted hour component on each weekday. This is a useful description of the pooled pattern, with the same US-centred scope as the rest of the collection.
Putting the components together
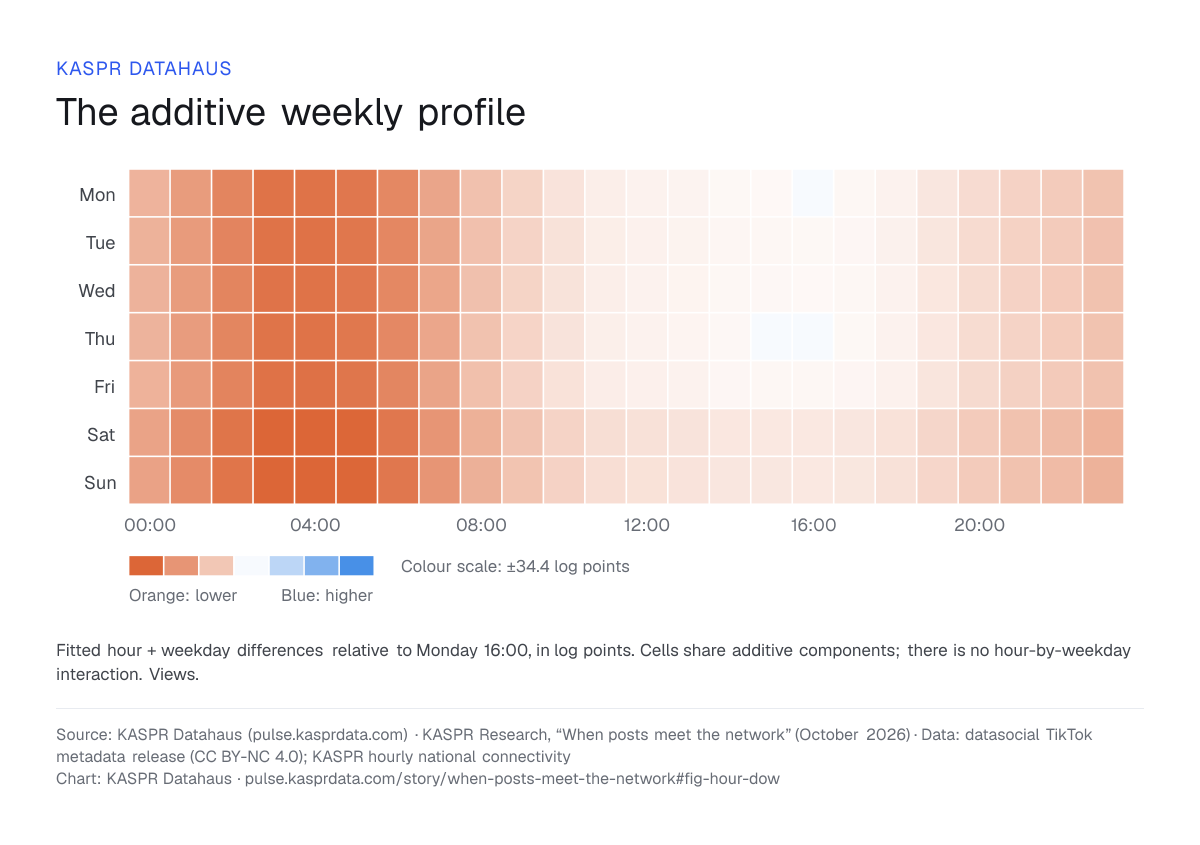
The weekly map combines the fitted hour and weekday components. Each cell is a difference from Monday at 16:00. Its interval includes the covariance between hour and weekday estimates. The map illustrates the additive timing model; it does not estimate a separate hour-by-weekday interaction.
Conditions around publication
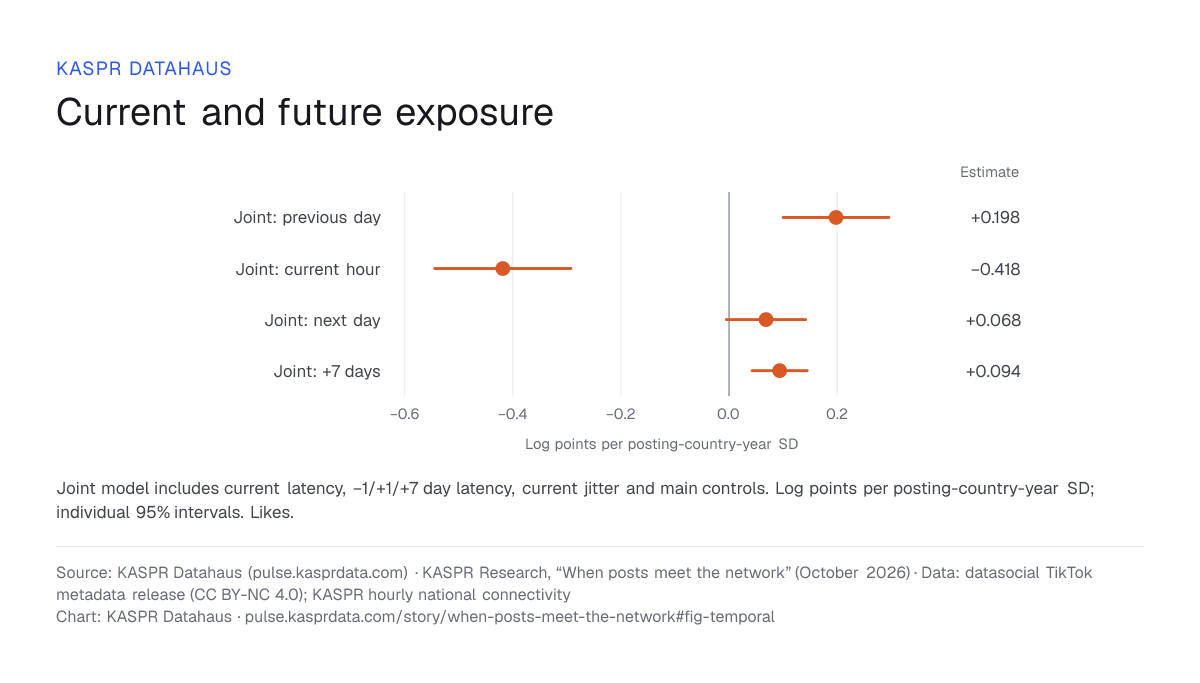
The temporal comparison retains posting-hour latency and adds latency one day before, one day after and seven days after publication. It also retains current jitter and the main controls. For likes, future latency remains associated with engagement after conditioning on current latency. Because engagement accumulates after publication, these comparisons describe relationships with network conditions around posting. They are temporal diagnostics, rather than event-study pre-trends.
Explore the fitted differences
Choose a starting weekday and hour to compare nearby slots. The explorer reports descriptive differences from the current timing model, with individual 95% intervals. It carries hour and weekday covariance across midnight and the end of the week. Use it to explore the observed profile, without treating the numbers as a forecast for an individual post.
Explore nearby posting slots
views, relative to Tuesday 19:00: −2 h: Tue 17:00 +3.749; −1 h: Tue 18:00 +2.618; +1 h: Tue 20:00 −2.533; +2 h: Tue 21:00 −4.621.
The study brings posting time and independently measured network conditions into one large observational analysis. The latency association for likes has stronger statistical support across the reported comparisons; shares calls for a more qualified reading. The broad geographic coverage adds context, while the sample composition keeps the main findings closest to the US-labelled posts that supply most of the evidence.
How we know
Questions and answers
- Is higher national internet latency linked to lower TikTok engagement?
- In the main model, a posting hour whose national latency is one standard deviation above the country’s annual mean is associated with 0.389 log points lower likes, 0.194 lower views, 0.077 lower comments and 0.073 lower shares; saves is less precisely estimated. The comparison is between posting hours after accounting for country-specific daily conditions, recurring local weekly patterns, post characteristics and snapshot age. These are log points for log(1+counts), not percentage changes in average counts.
- How much of the study’s data comes from the United States?
- About 85–86% of posts in each year are US-labelled. Separately, the US supplies 78.2% of the identifying information for the main latency estimate, a figure that describes the information behind a coefficient rather than the share of posts. The findings primarily describe this US-centred collection; equal-country weighting and removing the US give less precise estimates.
- Does jitter relate to engagement the same way as latency?
- No. Jitter, the variability in probe round-trip times, is positively associated with engagement when latency is in the same model: 0.498 log points higher likes and 0.284 higher views per standard deviation. Latency and jitter therefore need separate interpretation.
- Does posting at a different hour raise engagement?
- The study does not estimate that. Its timing profiles and slot explorer compare fitted differences between posting slots, relative to Monday at 16:00, and describe the mix of posts and audiences observed at each hour. They are neither predictions for an individual post nor estimated gains from moving it.
- What data does the study use?
- 2,579,434,940 TikTok posts from 2023 to 2025, in 16,005,925 cells across 236 countries, from the datasocial TikTok metadata release (CC BY-NC 4.0), matched to KASPR’s hourly national latency and jitter. Both network measures are expressed relative to each country’s own year: zero is its annual mean, and one is one annual standard deviation above it.