KASPR Regional Intelligence
How reliable is the internet where you operate?
Add the locations you are interested in and see each area’s internet record: typical quality, worst hours and disruptions in the past year. Free for up to 5 locations.
Add up to 5 locations or districts. Contact us for larger reports. Talk to us
1. Search for a place
Place names you type are looked up on our server. Uploaded files stay in your browser.
2. Enter an address or coordinates
Coordinates are matched to a district in your browser; nothing is sent. This address is sent to OpenCage to find its location. It is not sent to KASPR.
3. Upload a file
CSV or XLSX, up to 5 locations or districts. For larger lists, contact us.
Drop a file here, or
Your locations (0)
No locations yet. Search for a place, enter coordinates or upload a file.
KASPR reports on areas, not on individual addresses. Each location is placed in its district, or in its region or country where KASPR has no districts, and every figure describes that whole area. A street address or exact coordinates only decide which area a location falls in; they do not make the figures more precise.
Free check
Free
Up to 5 locations: each district’s grade, typical latency and stability, worst hours and the past year’s disruptions. No account.
Full report
US$99
Up to five locations or districts, monthly history from July 2025 to July 2026, every disruption, co-disruption between your districts, and exports. Pay once; 30 days to download.
Annual report subscription
US$1,000 a year
The one-off report for up to five locations, kept current: each monthly release updates it and the link is sent by email. Renews automatically after a year; cancel any time.
More data? Dashboard solutions
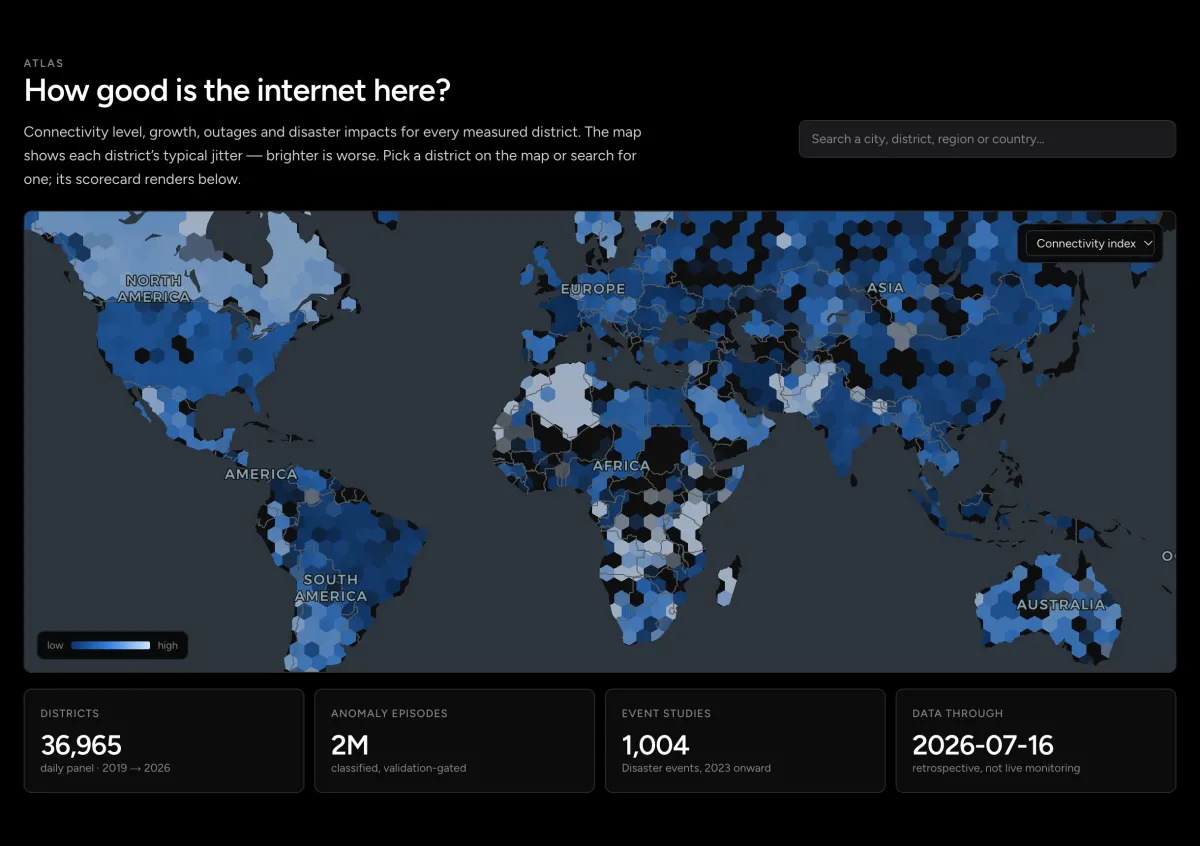
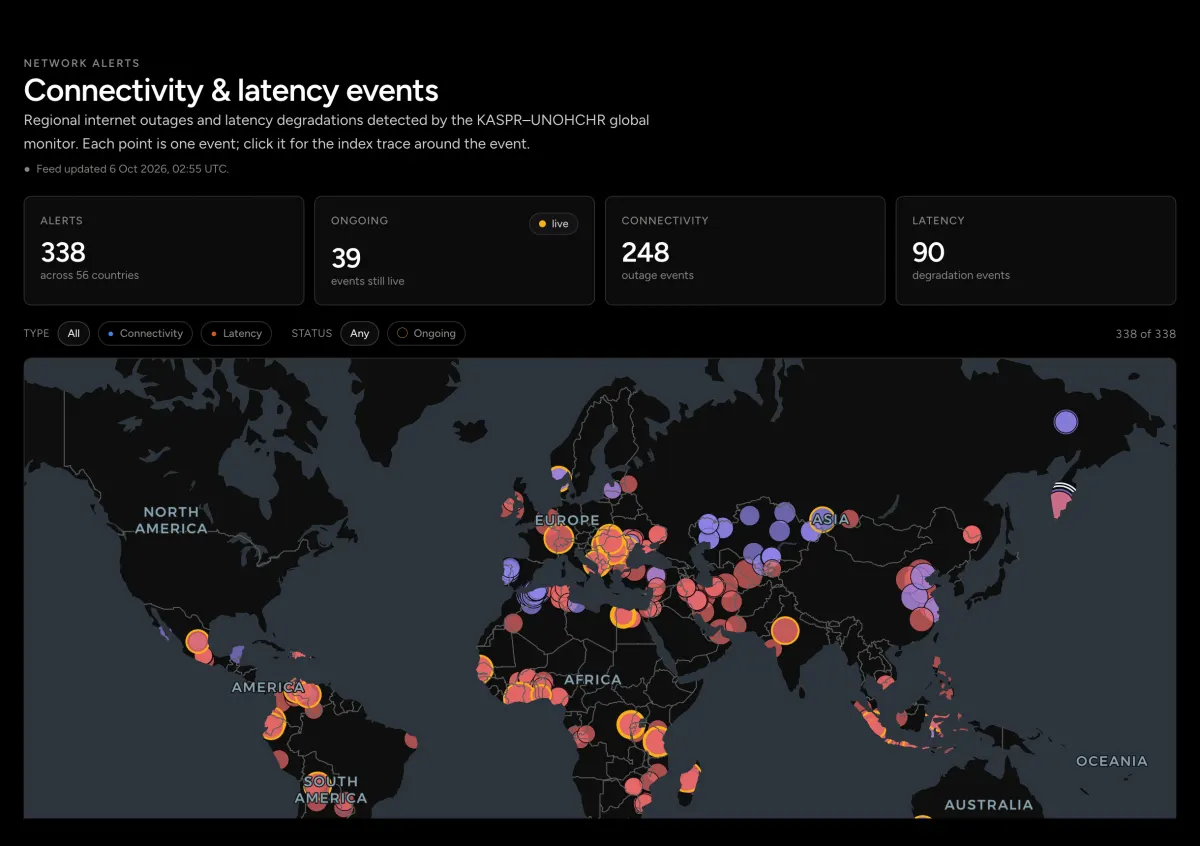
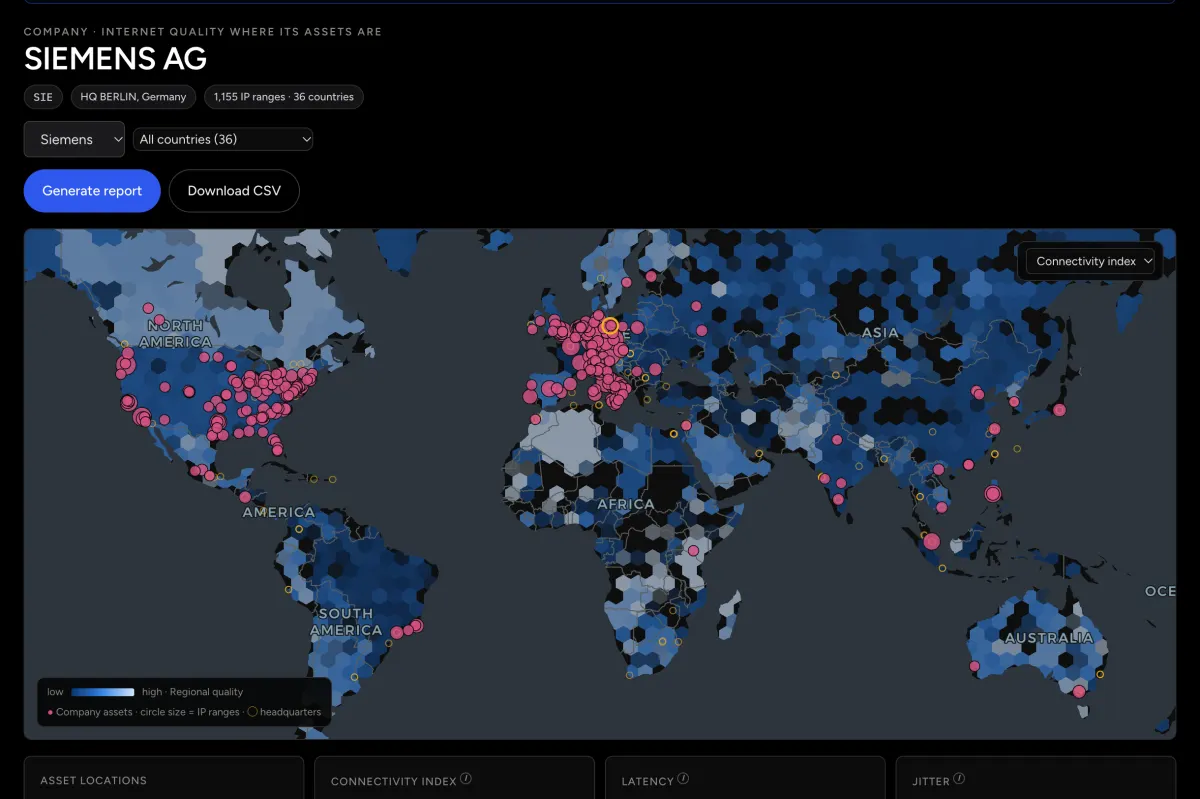
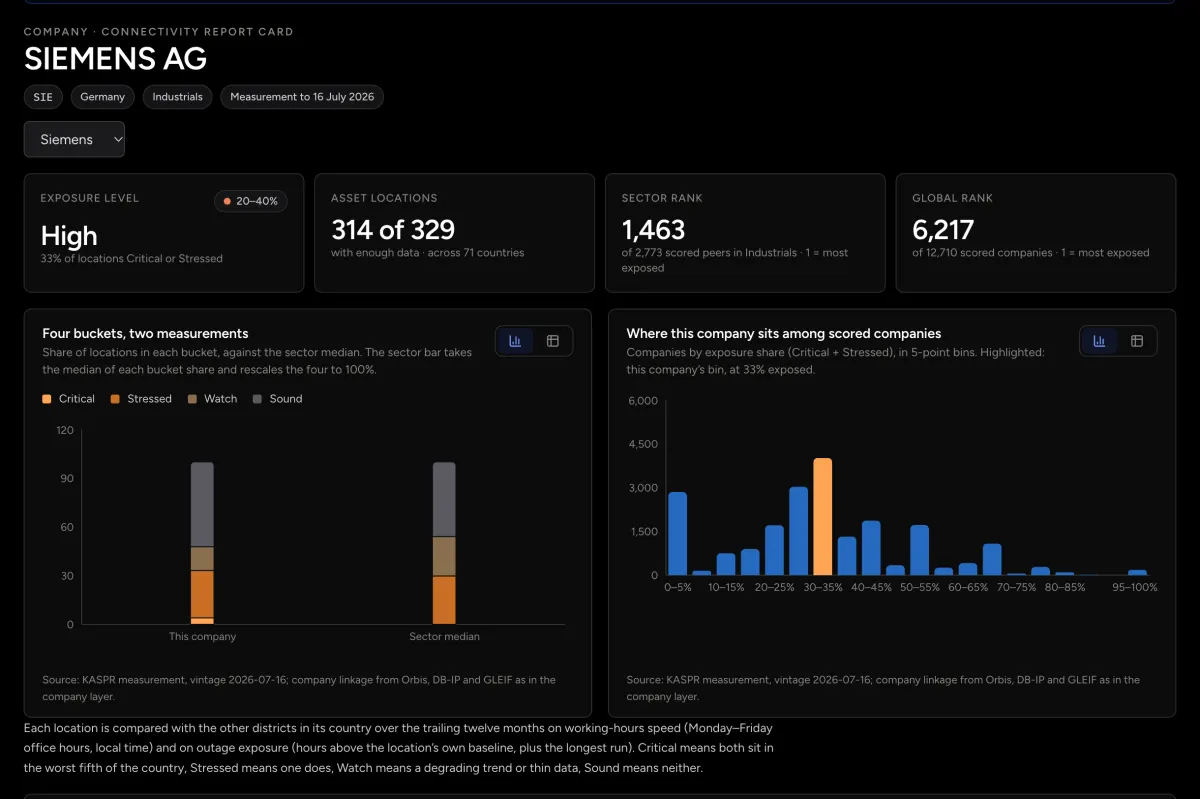
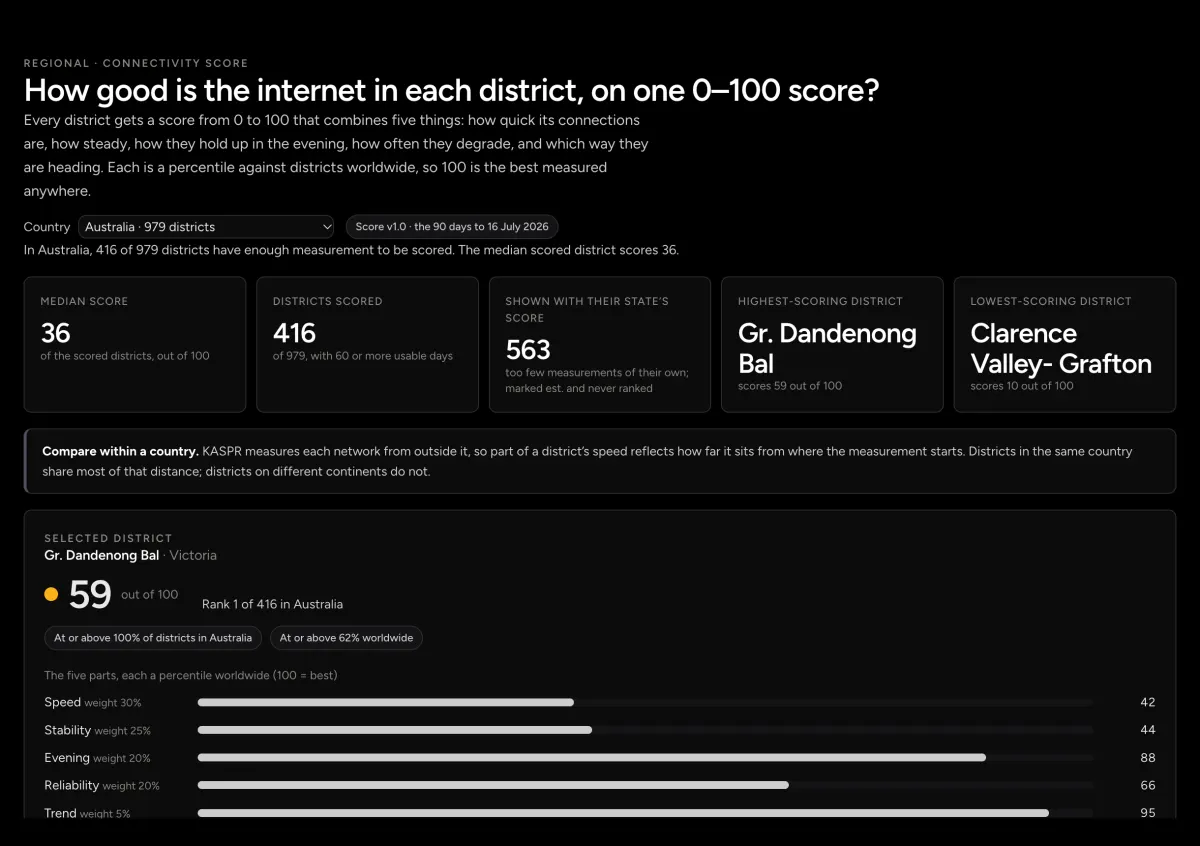
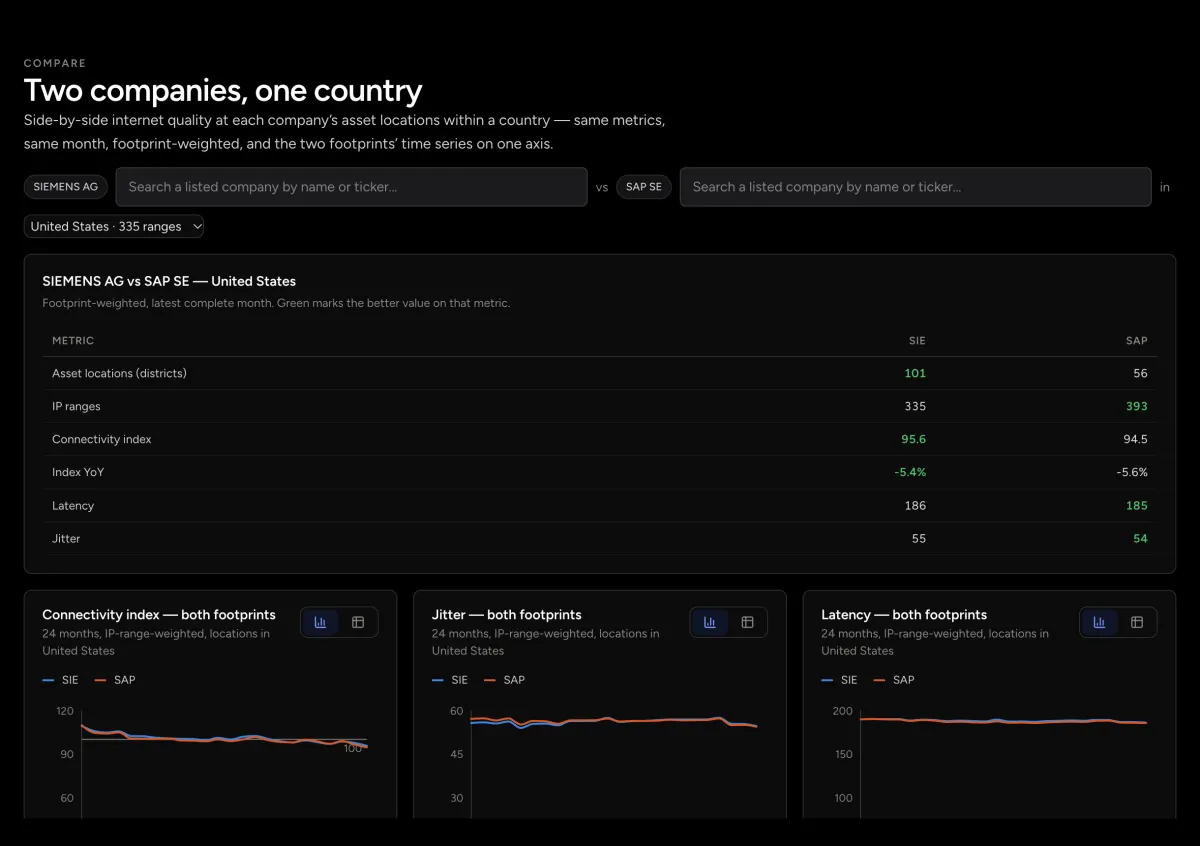
For more locations, more history or monitoring across whole countries, the KASPR dashboard opens the full record: every district on one map, anomaly events, company exposure, connectivity scores, side-by-side comparisons and more. Try it and explore the dashboard with free sample data.