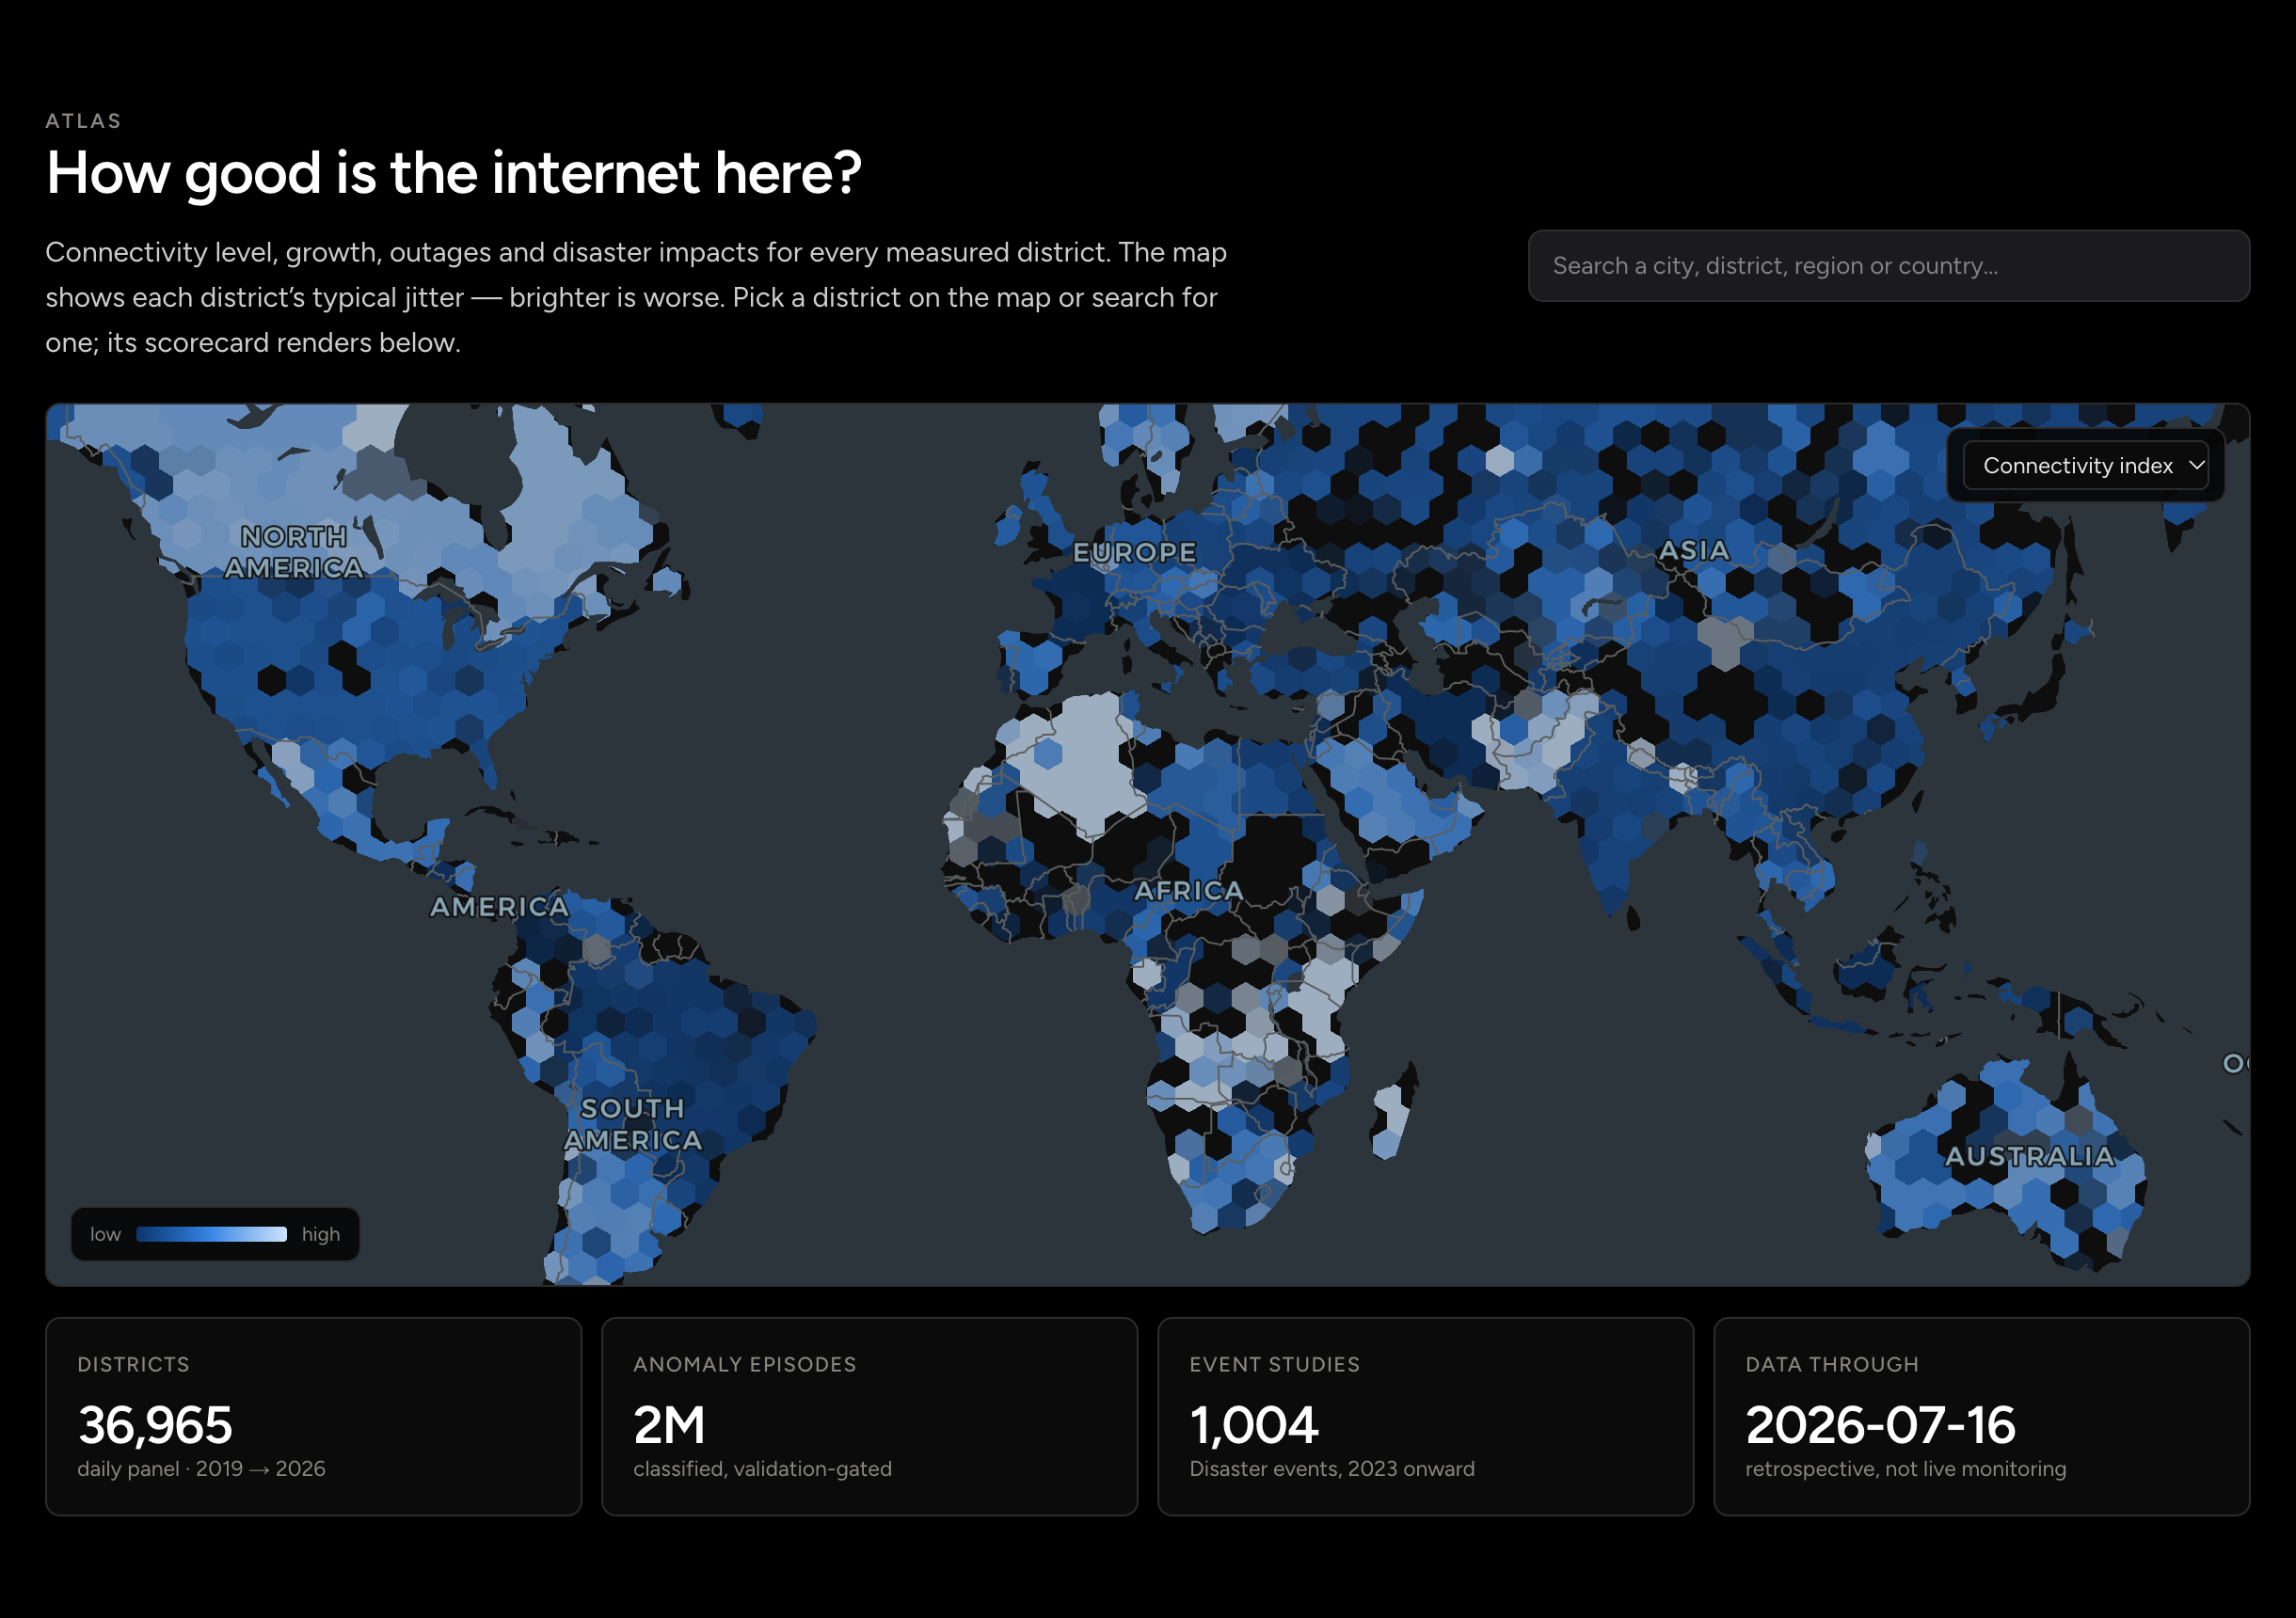
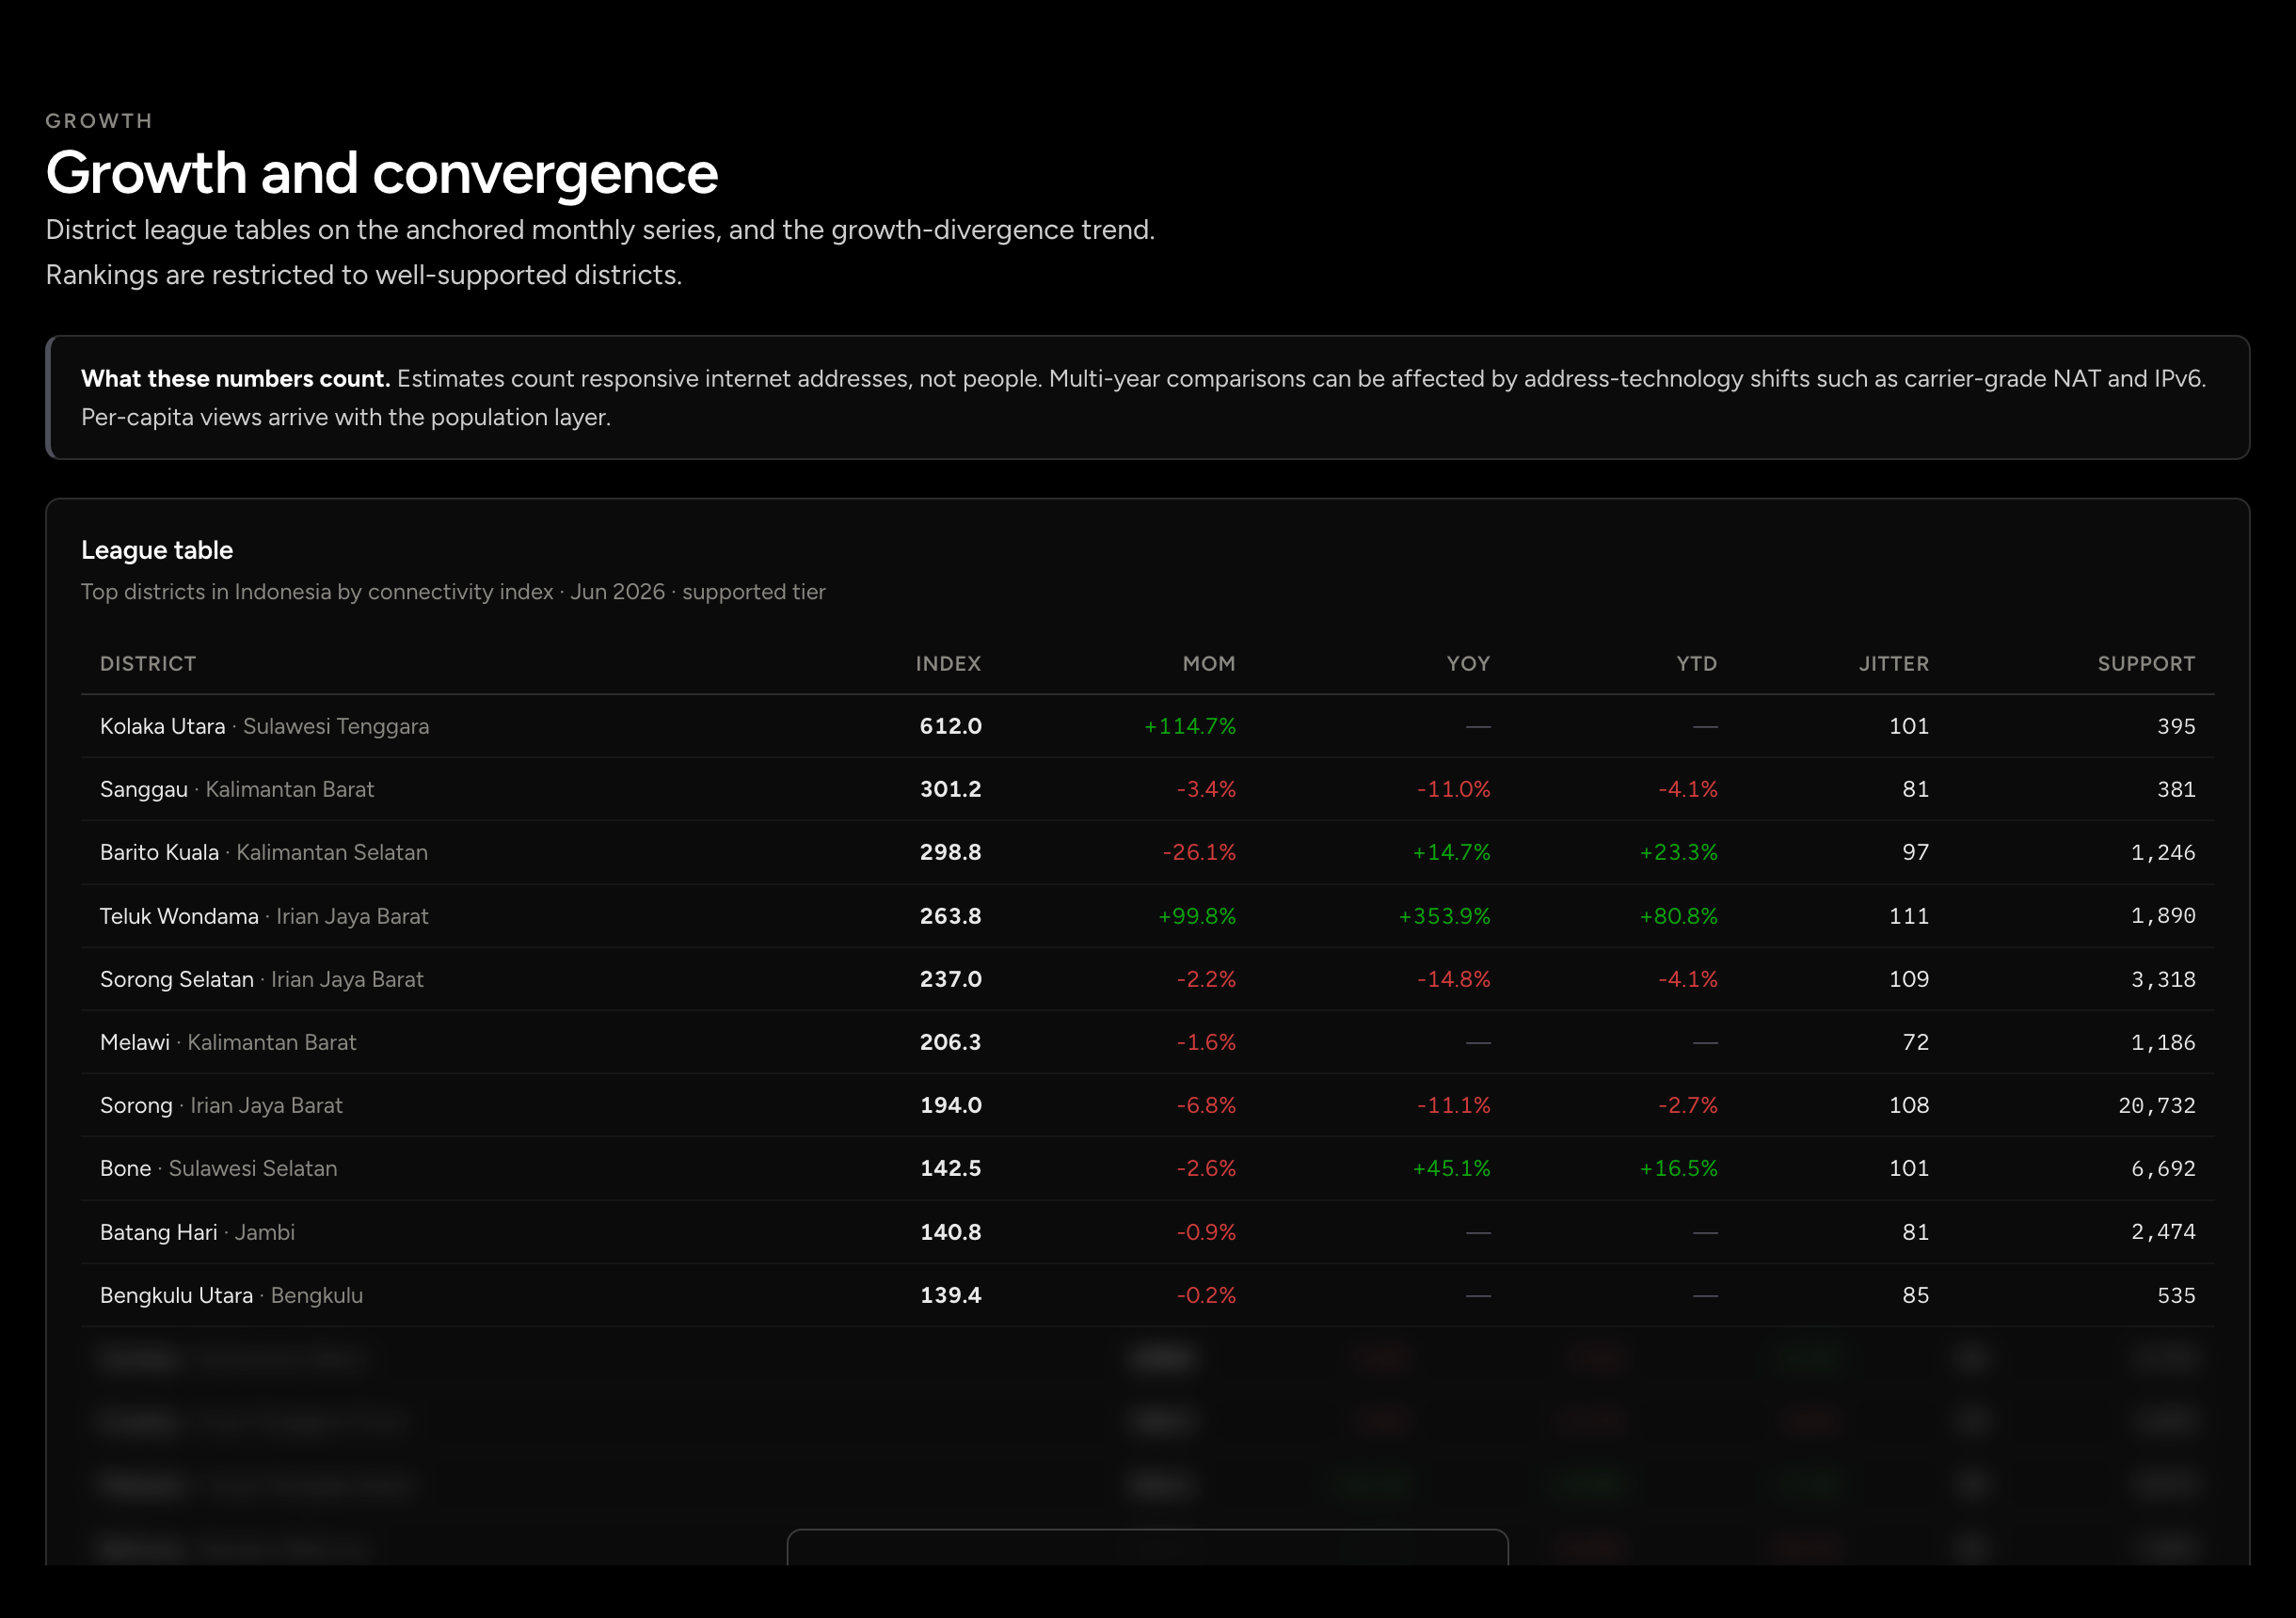
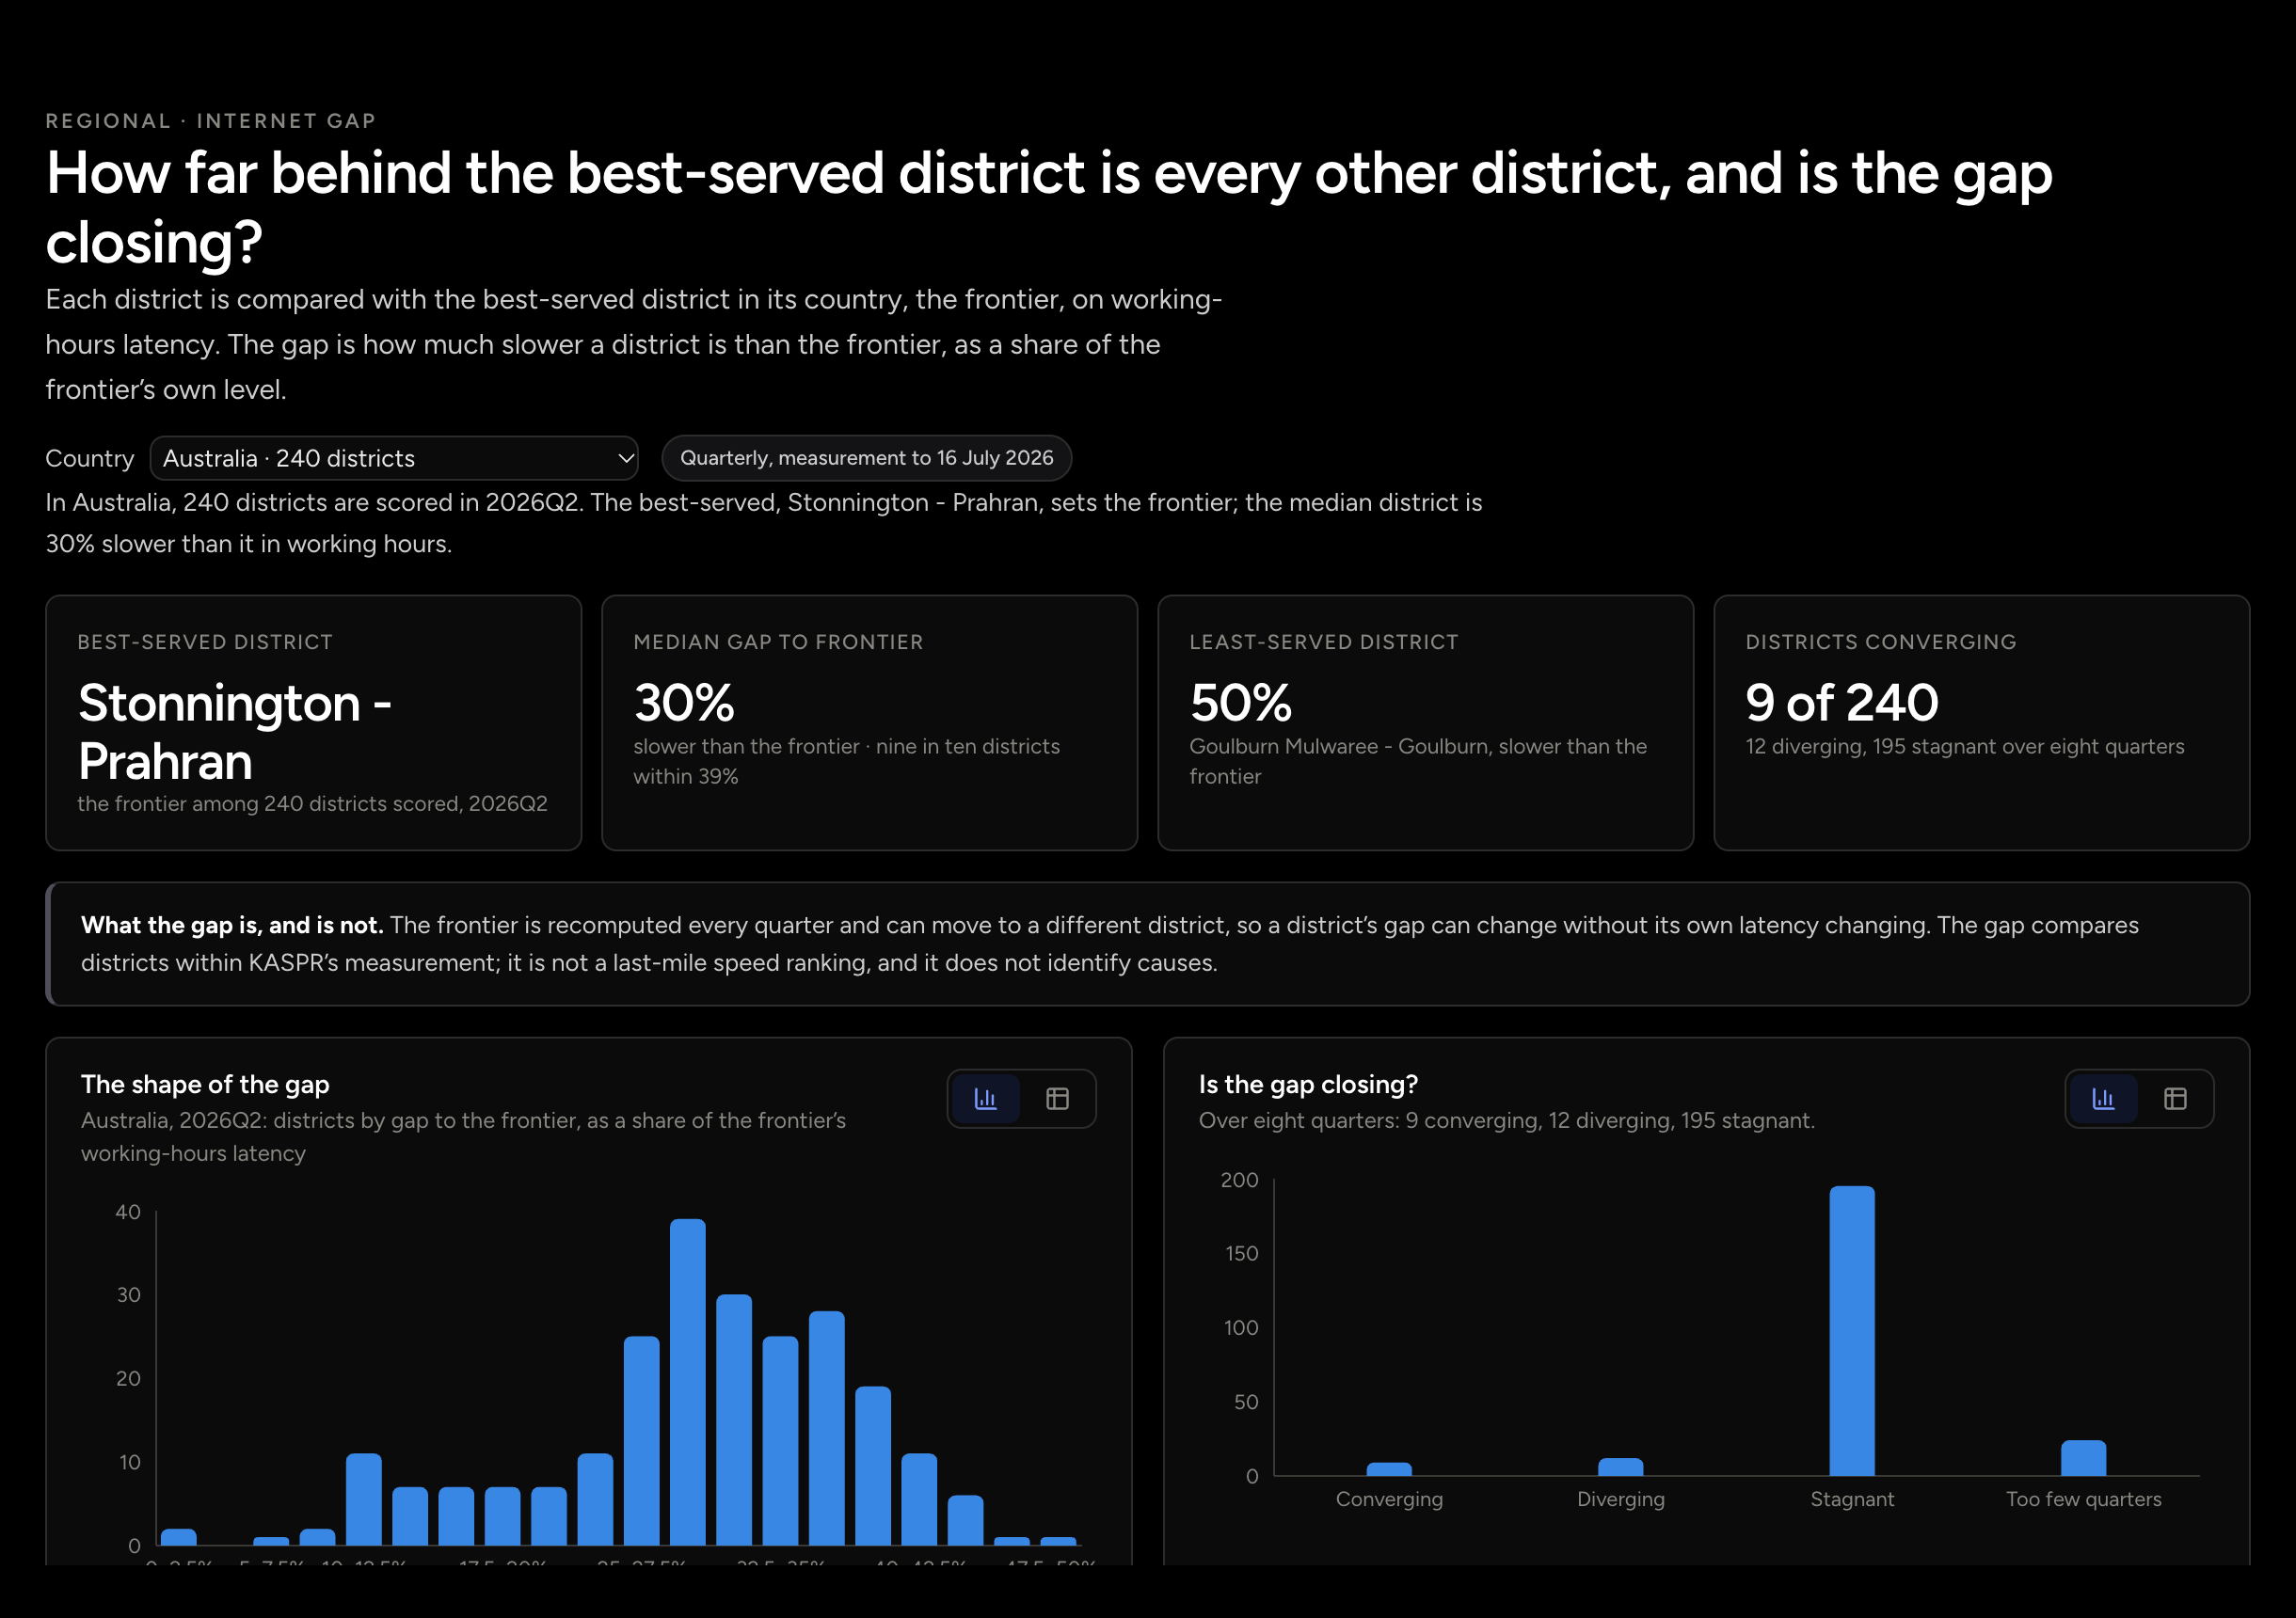
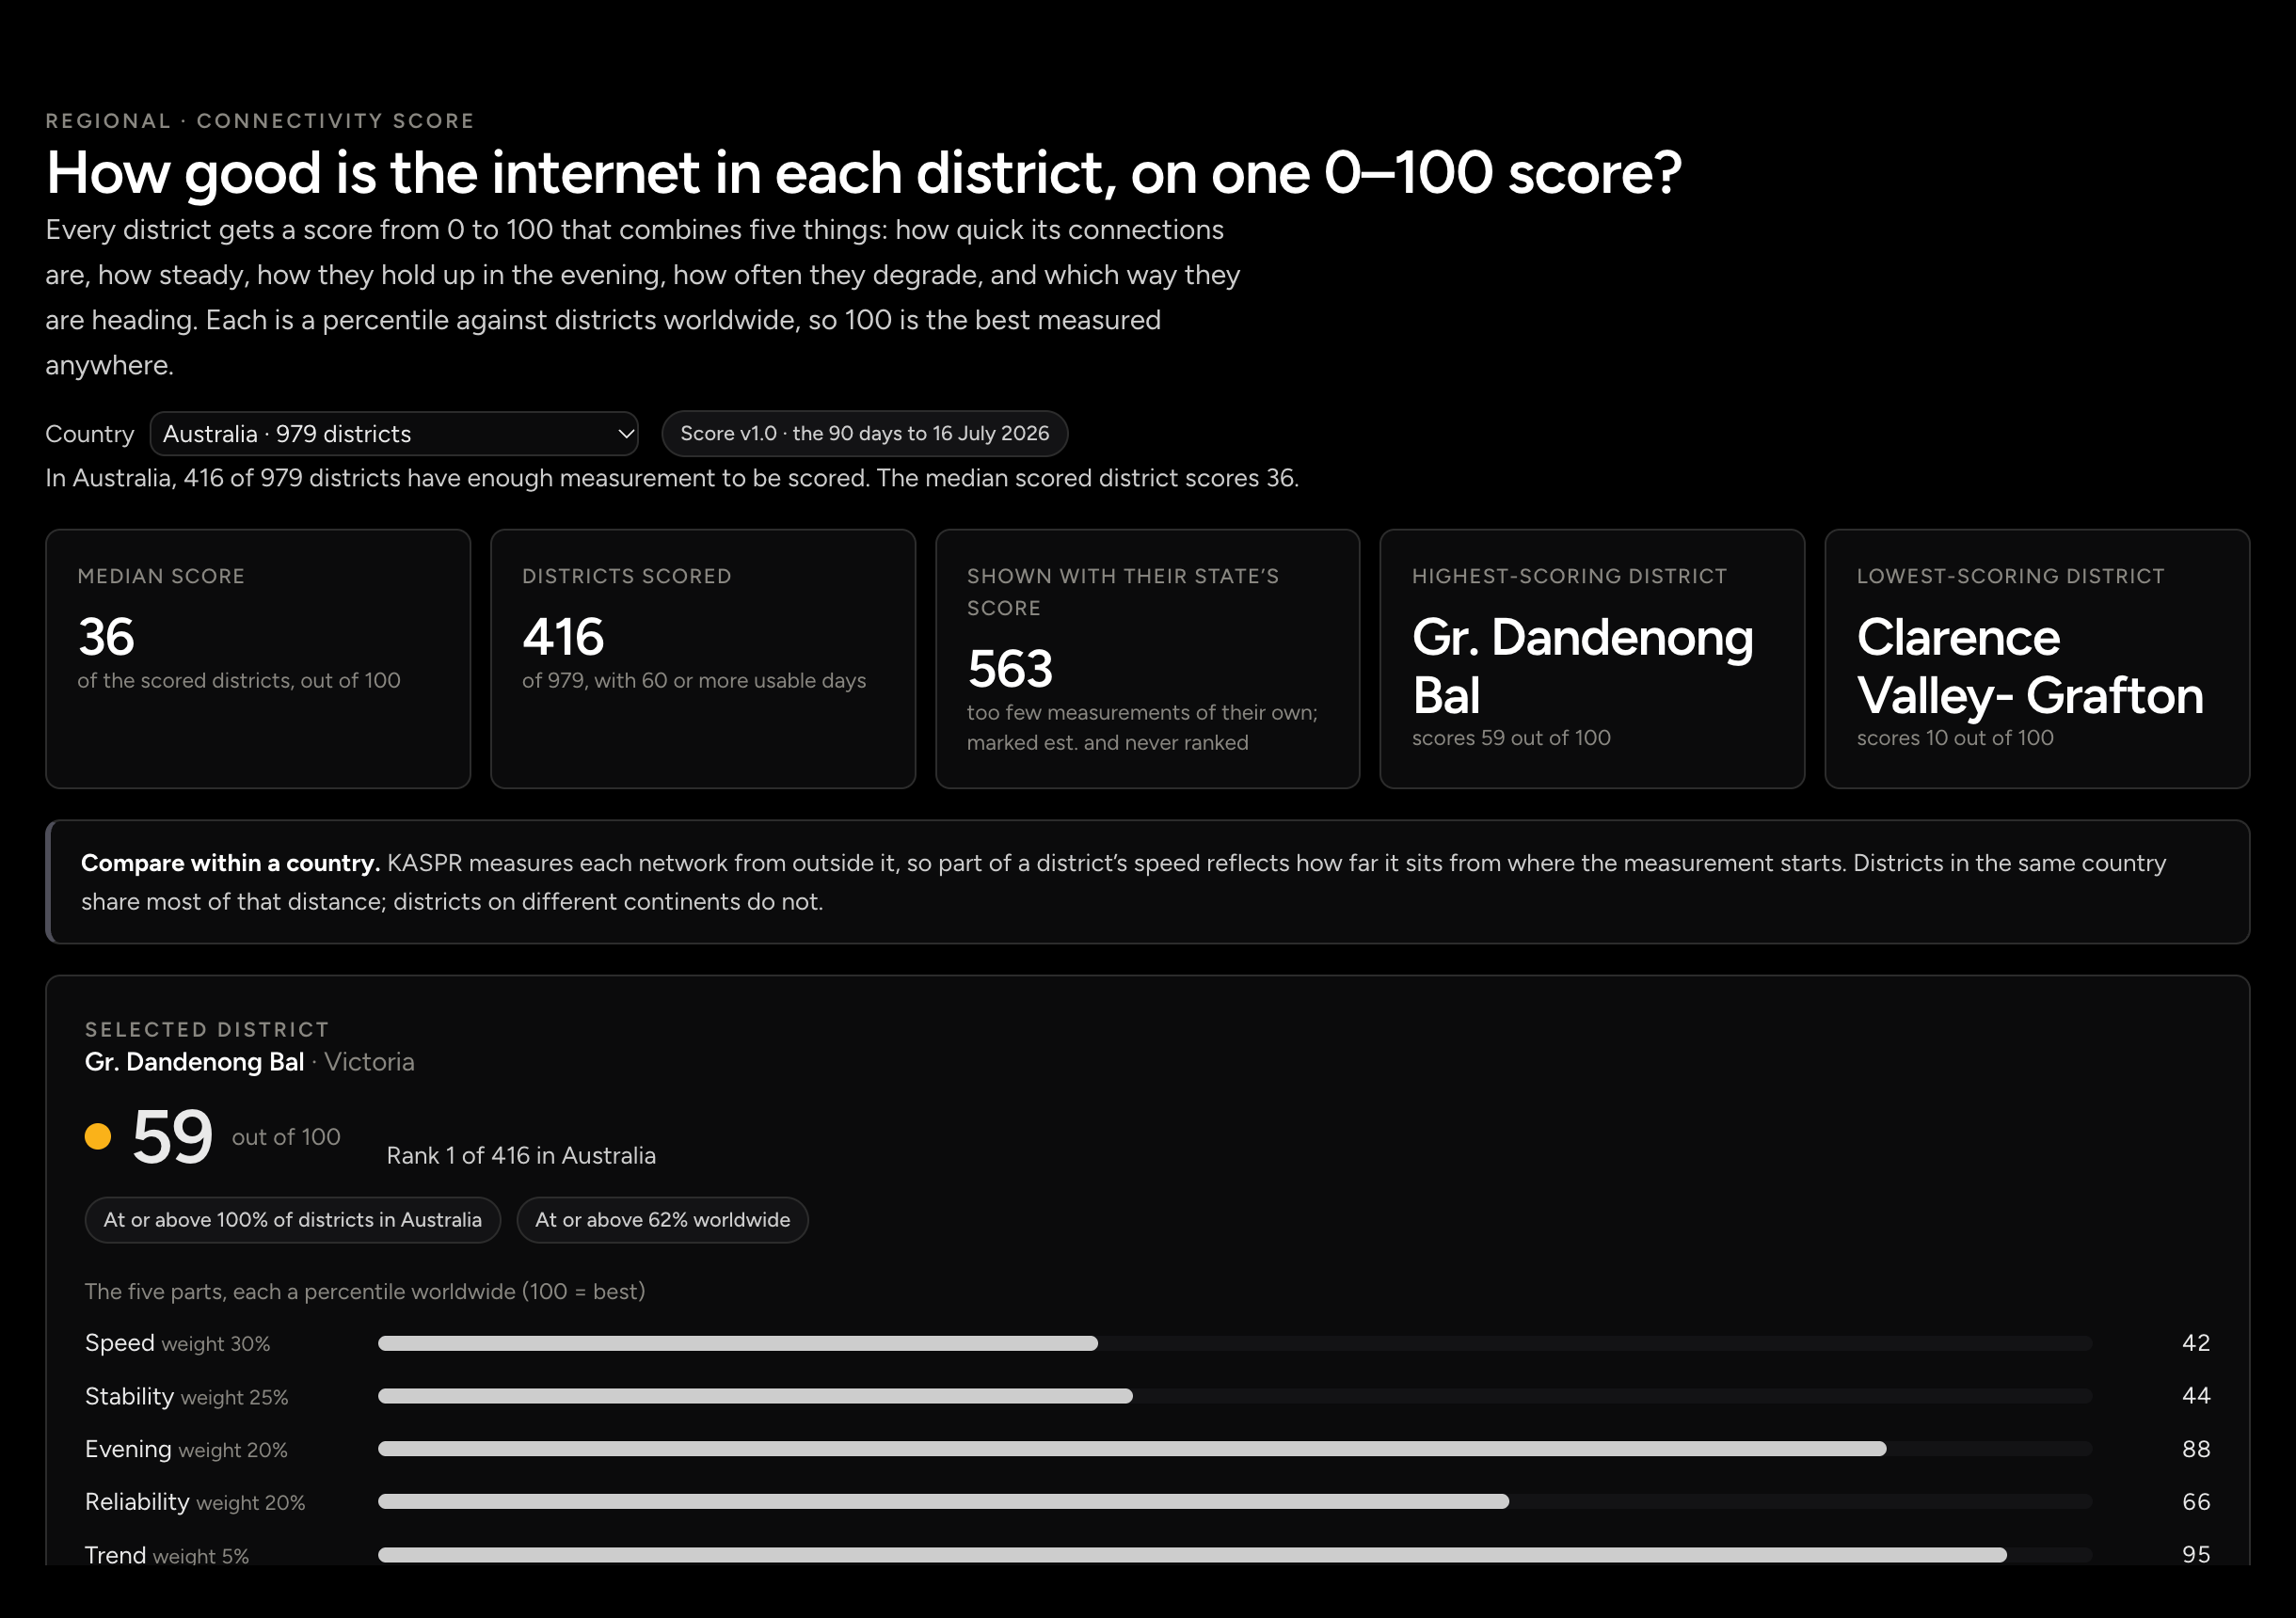
The dashboard’s left rail. Each application answers a different question from the same hourly, district-level measurement; the screens below are the real ones.
Baseline internet quality by district, month over month.
Regional Intelligence
The Atlas colours every district by connectivity, latency or jitter and opens any one of them to its typical day and week and the support behind it. Growth follows the same districts month over month: which are converging on their country’s best, which are falling behind.
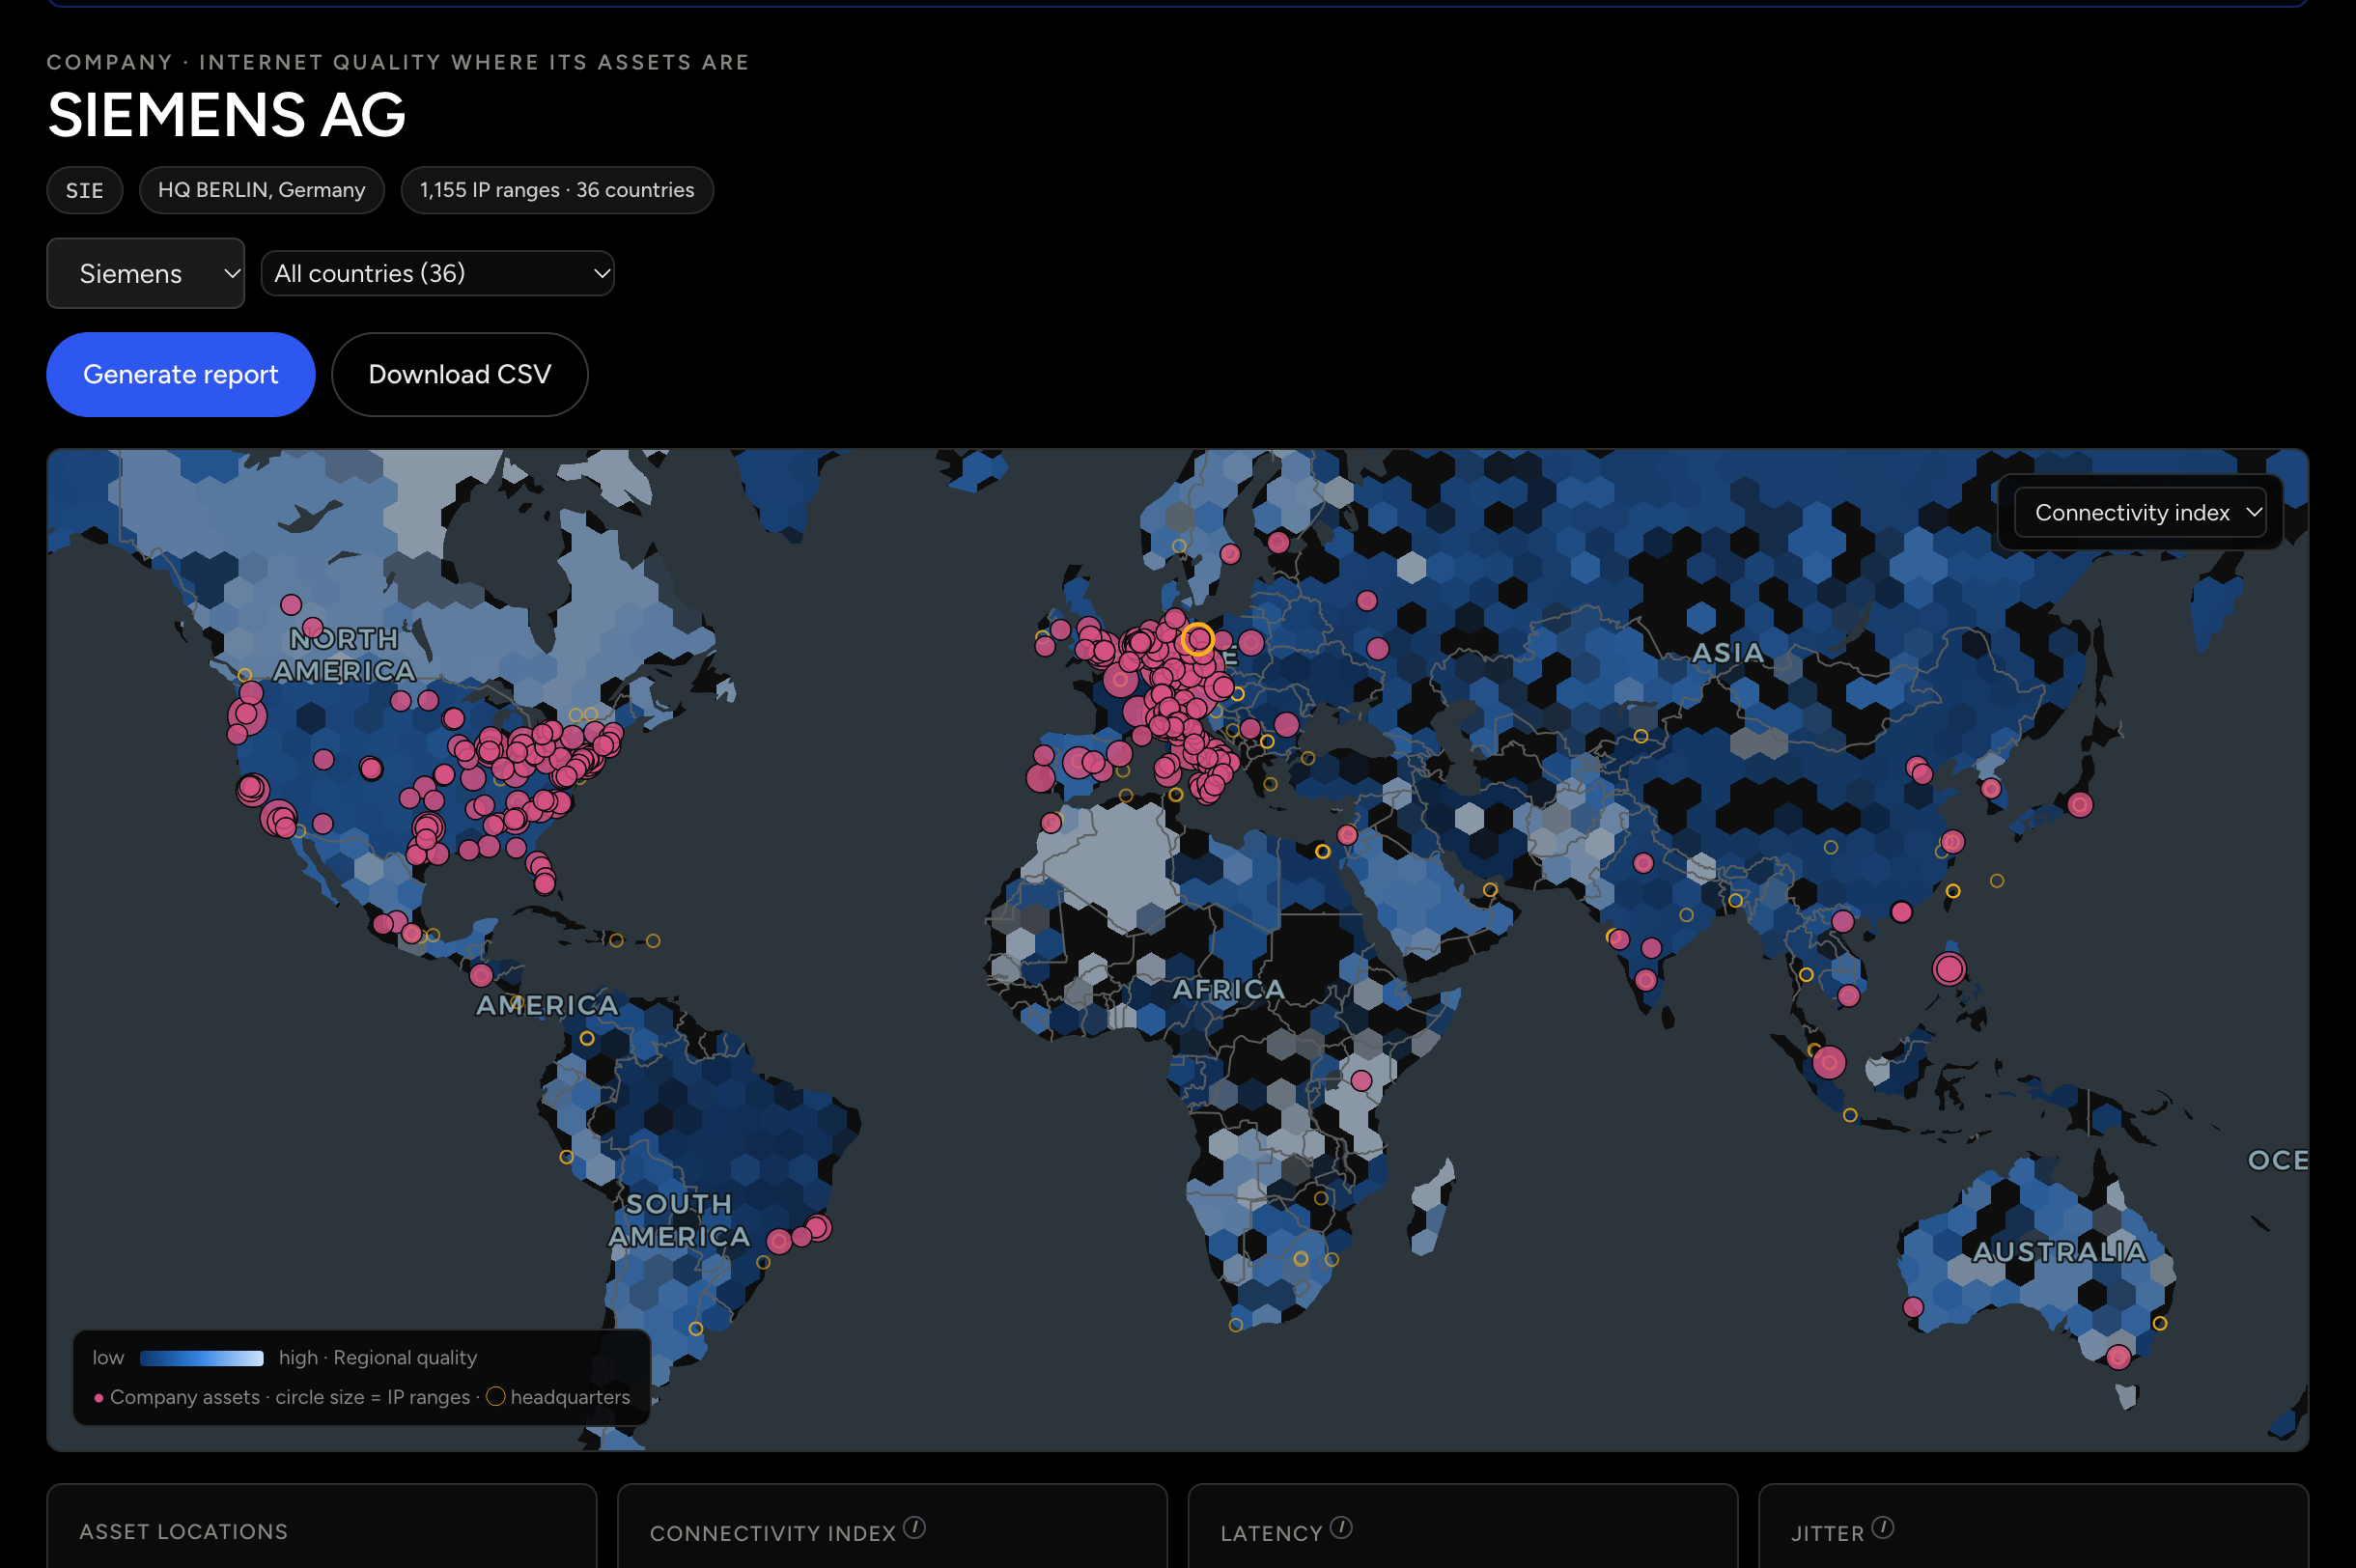
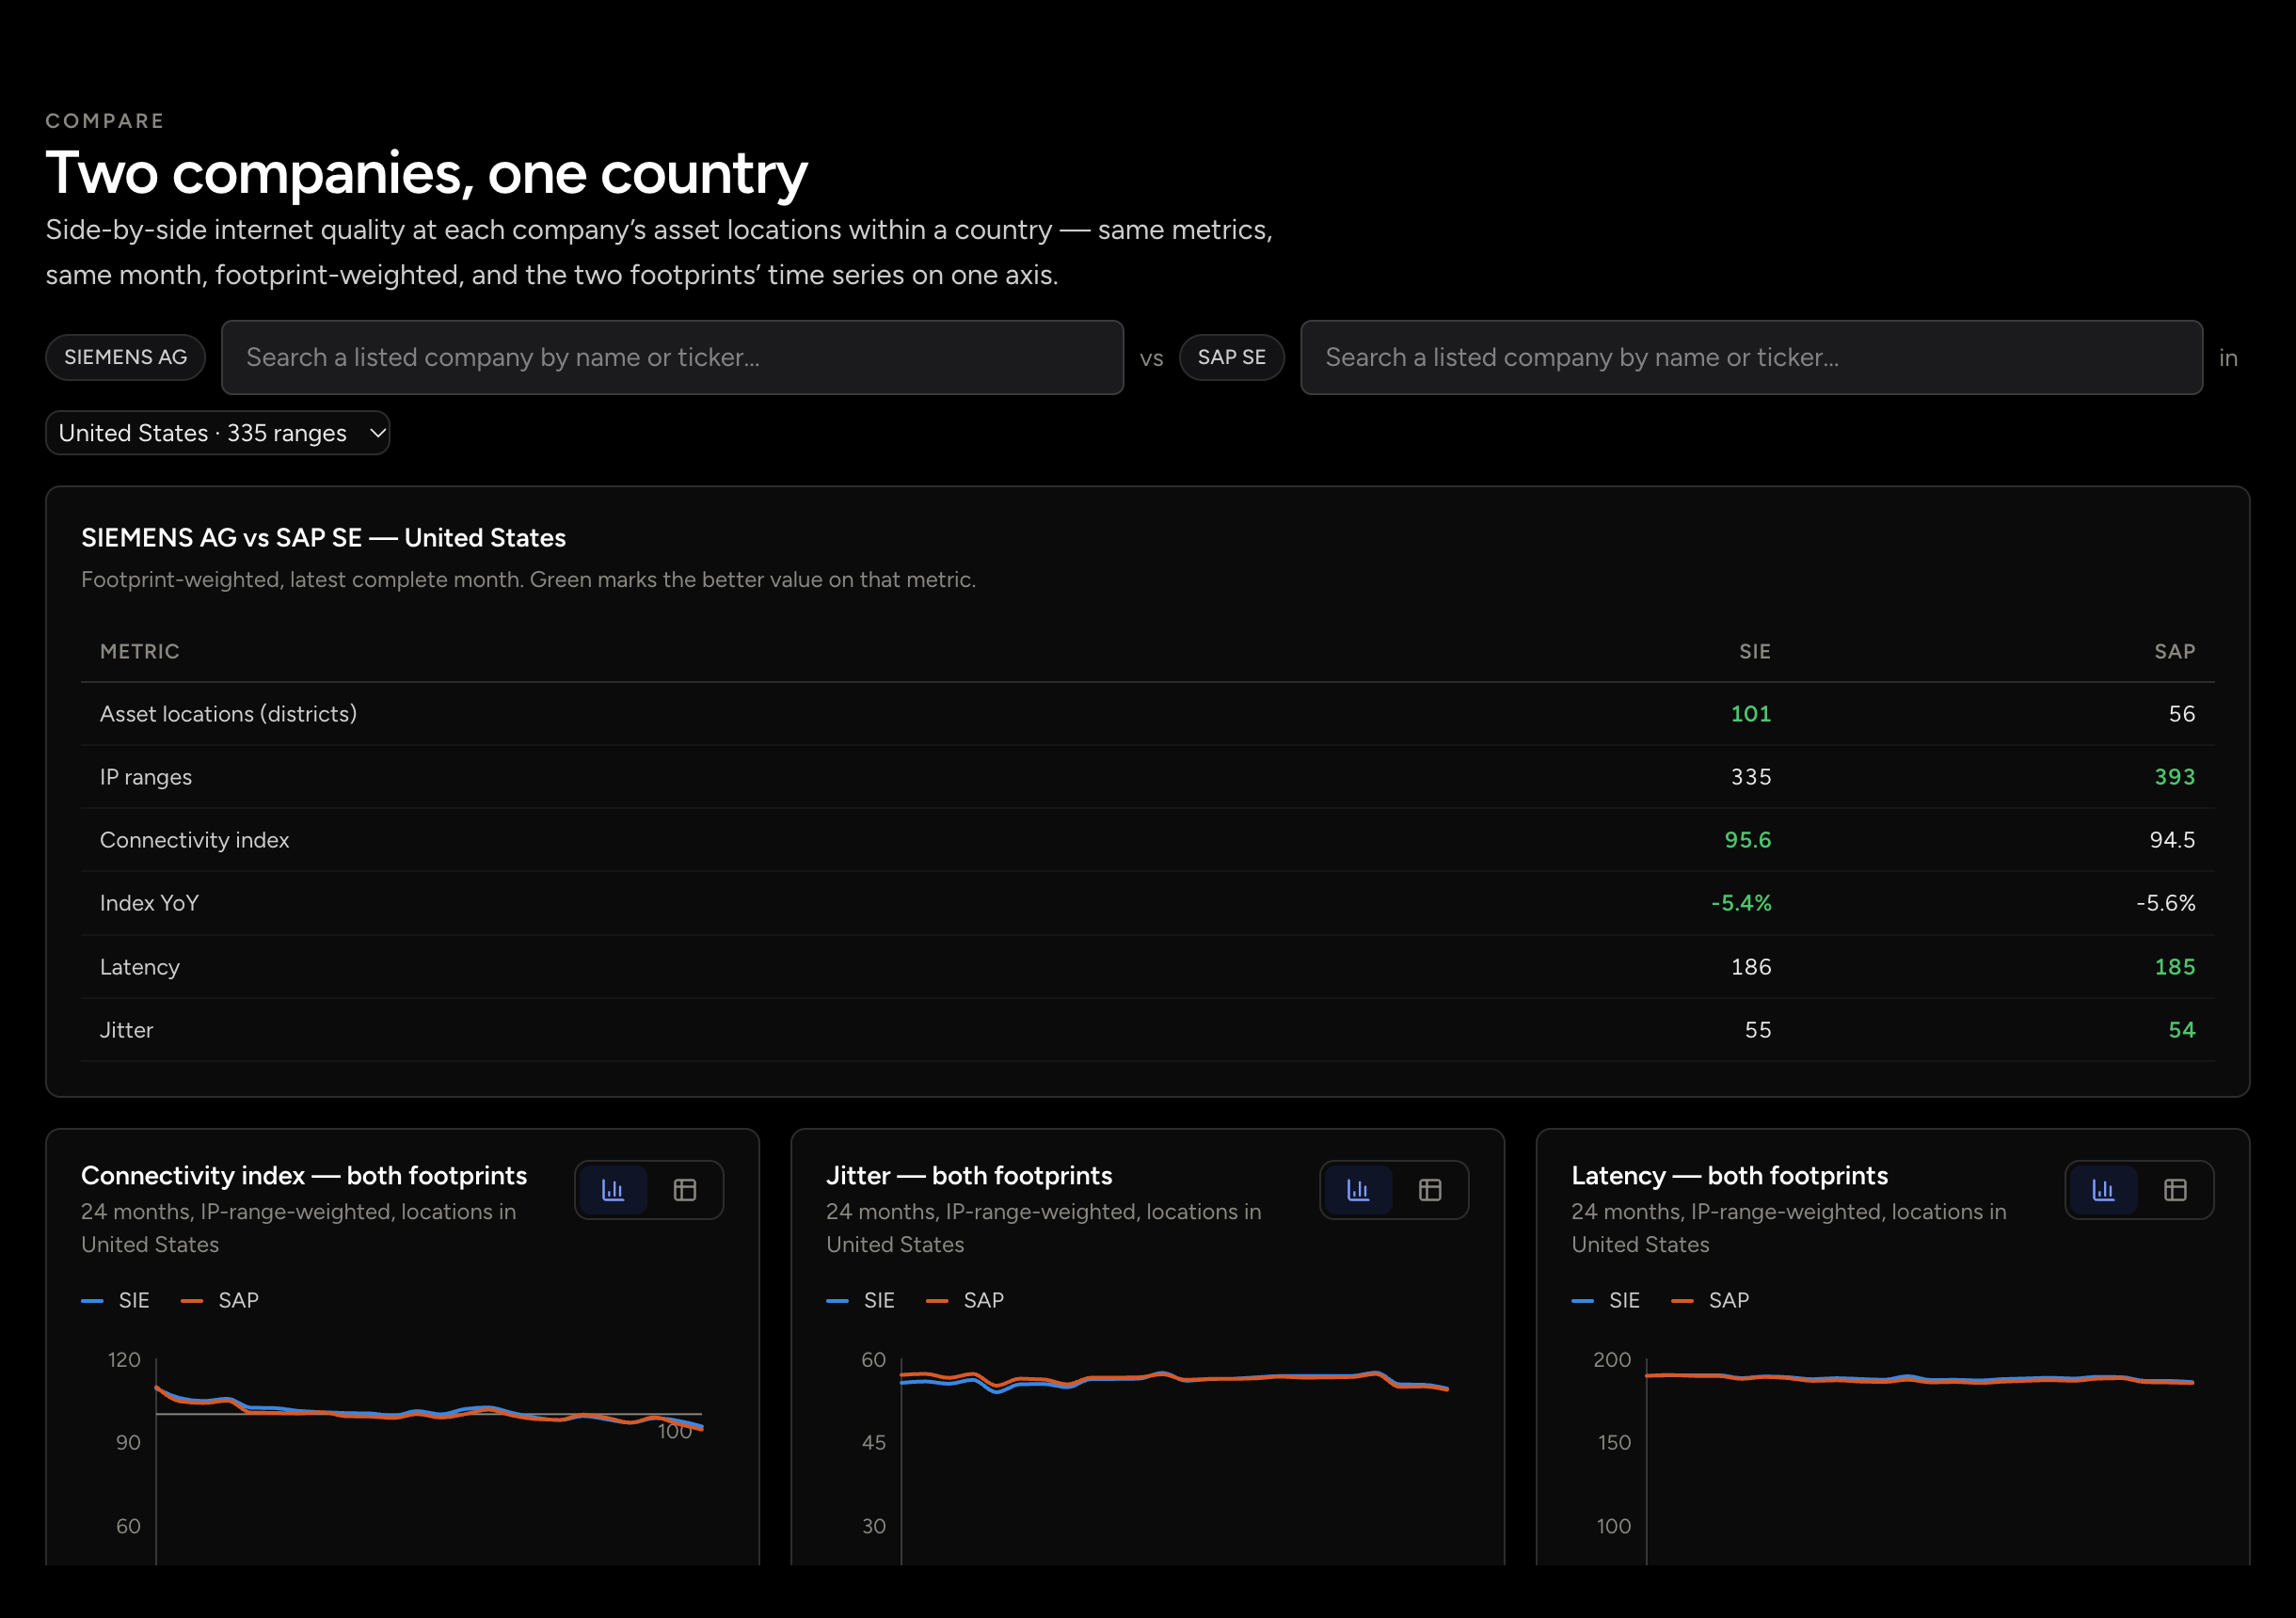
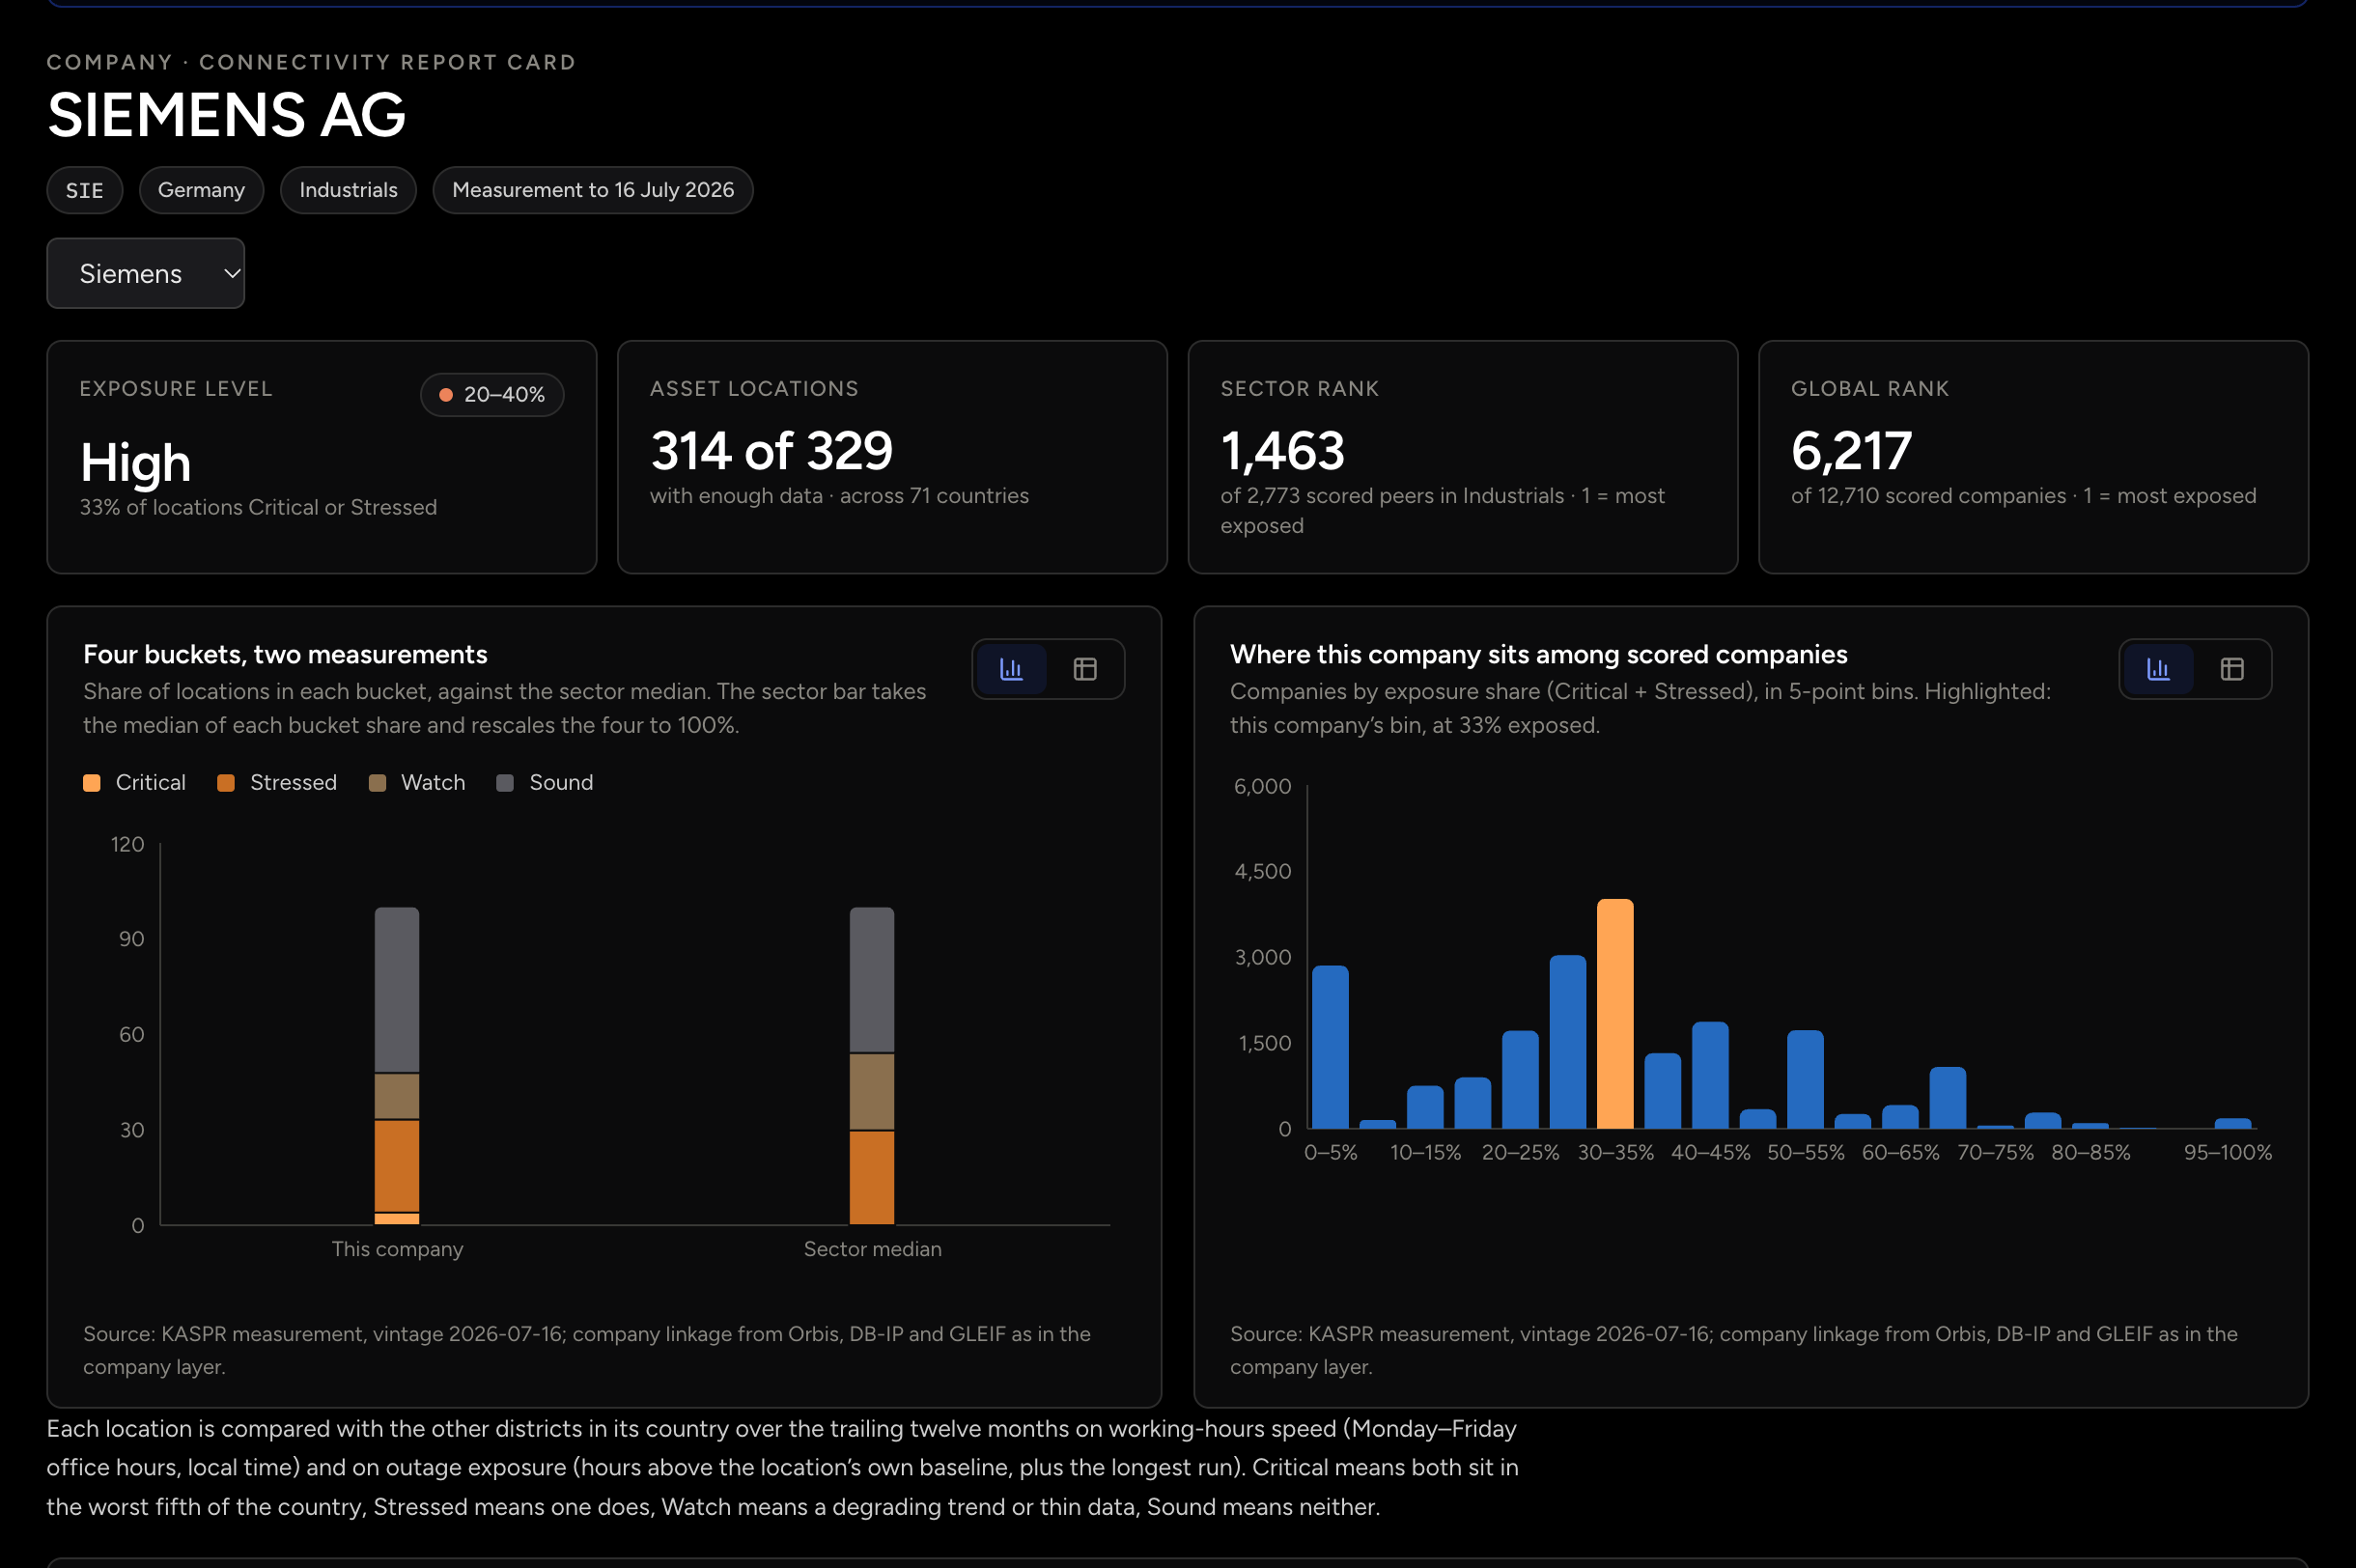
A listed company’s infrastructure footprint, located district by district and matched to its ticker: the connectivity around each site, which assets depend on fragile districts, and a peer to compare it with, two companies in one country side by side.
What just happened — anomalies, outages and disaster events.
Situational Awareness
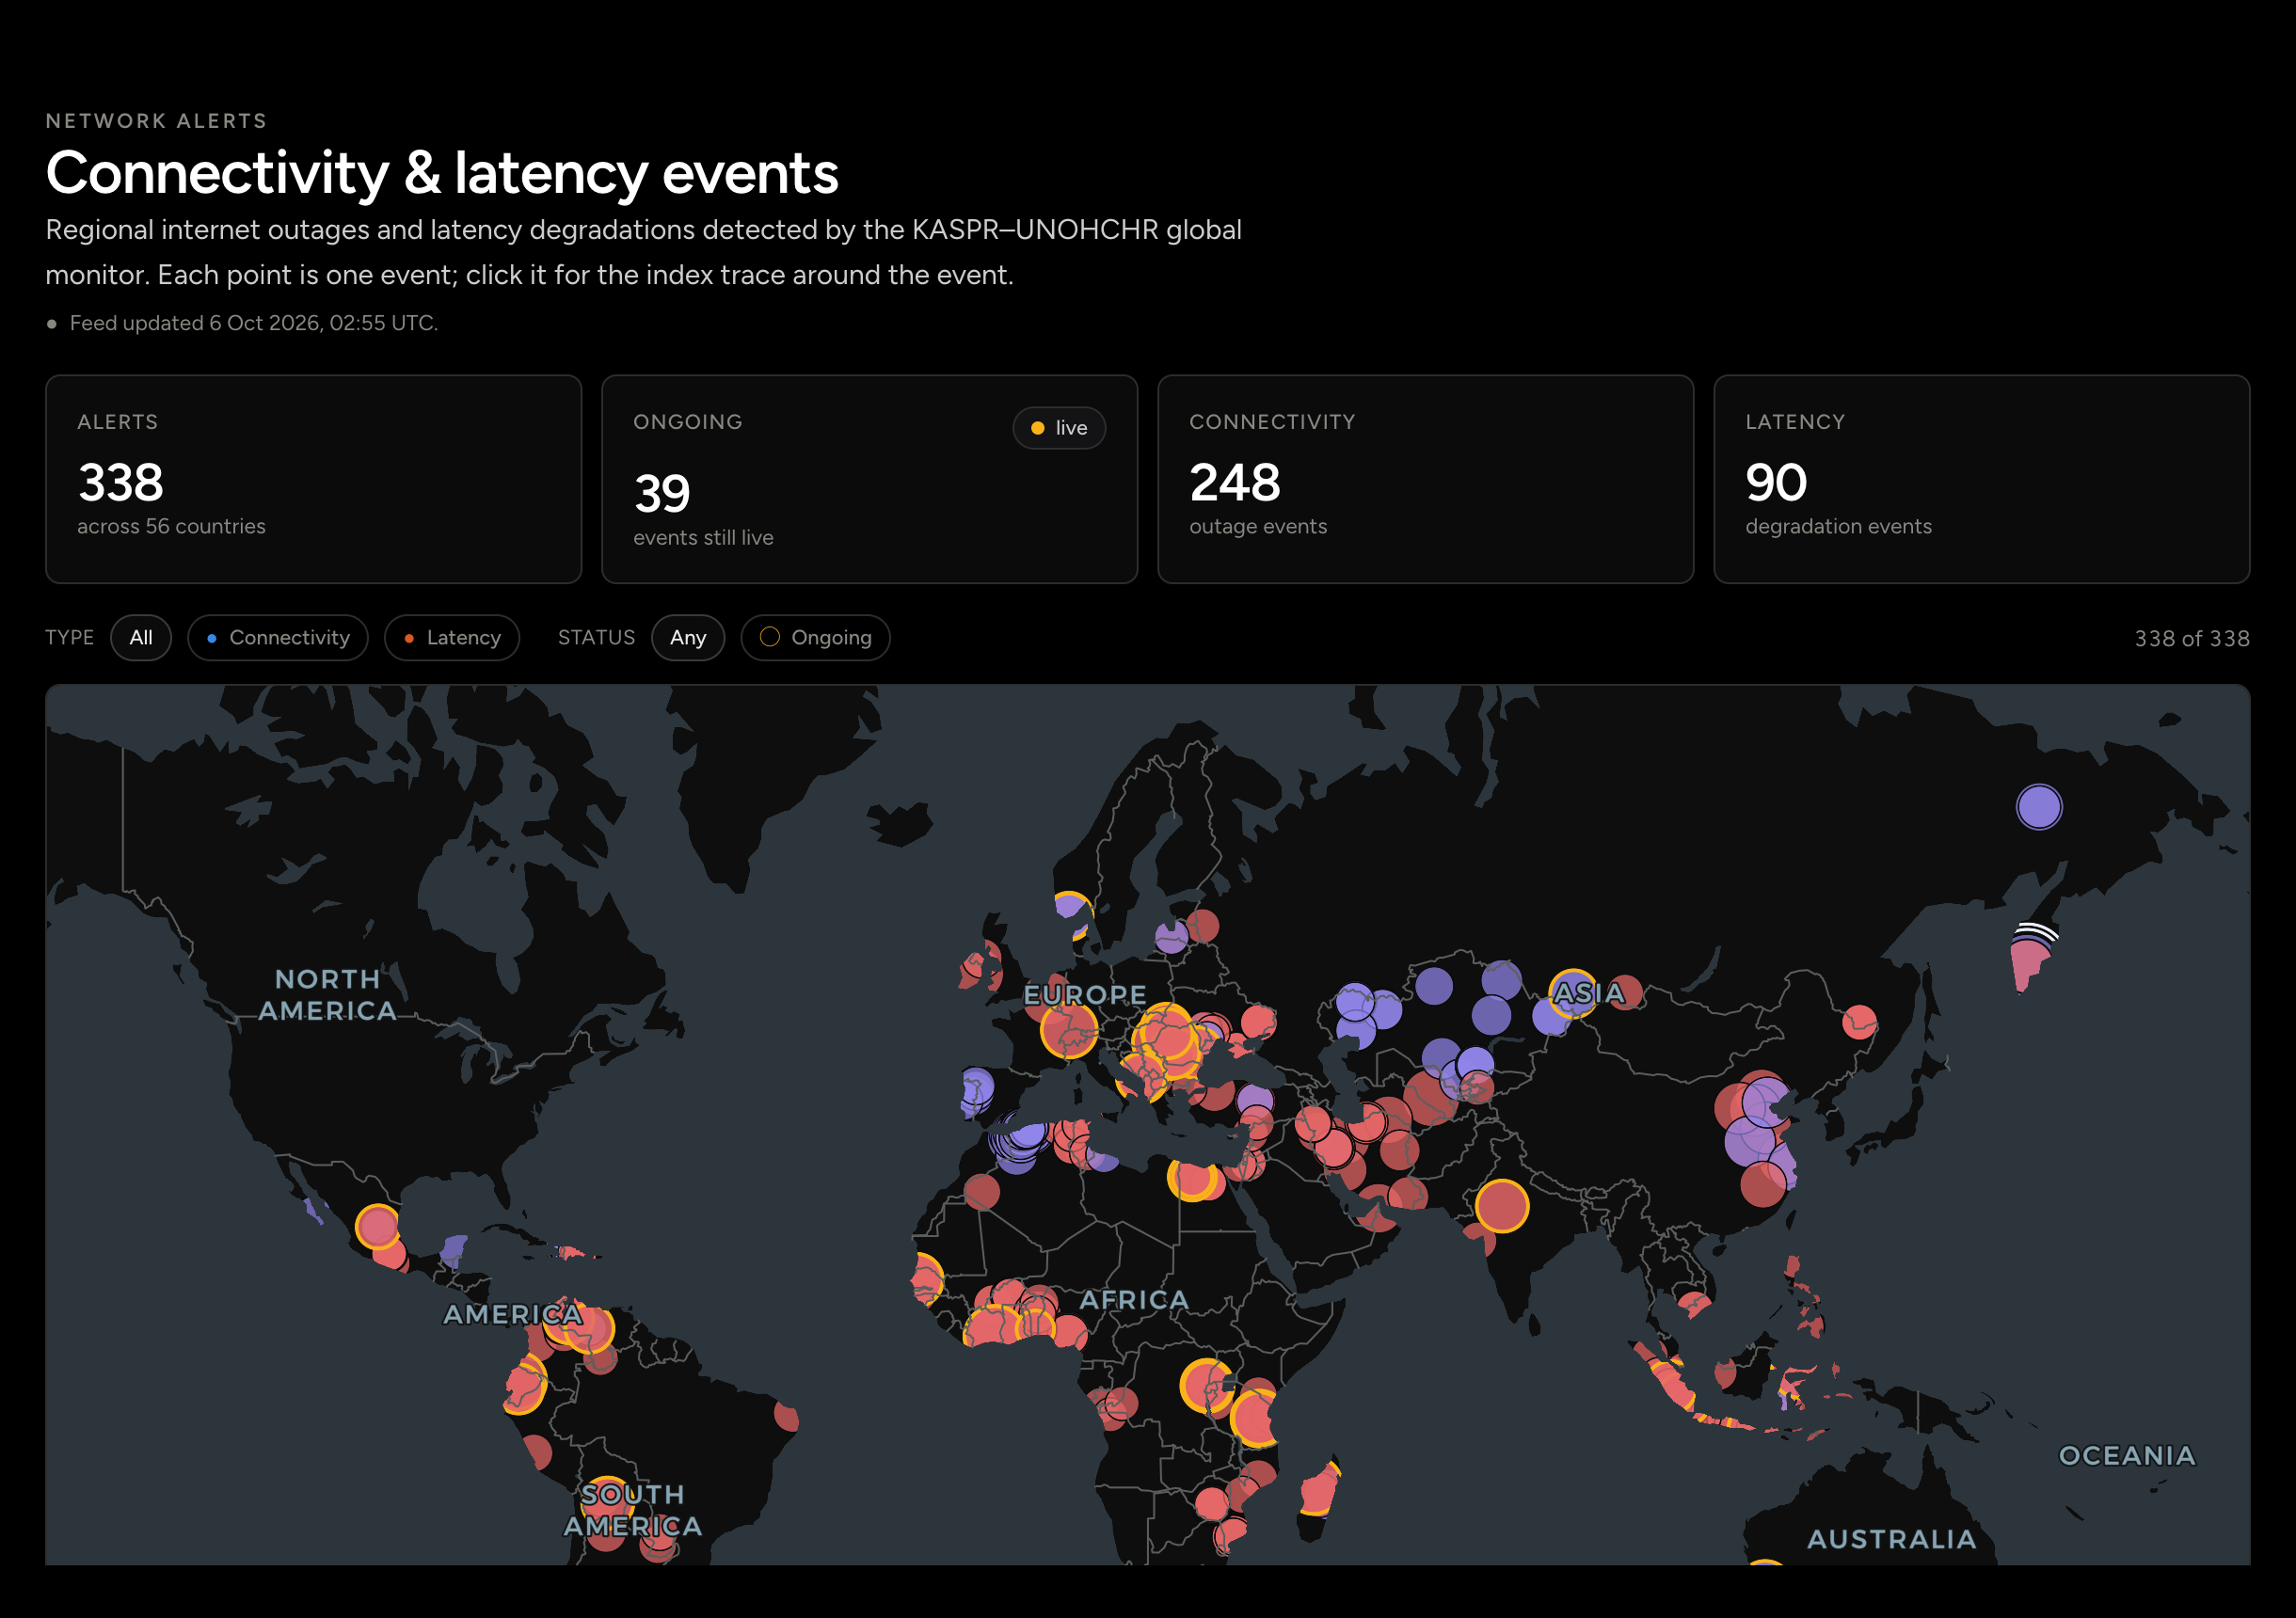
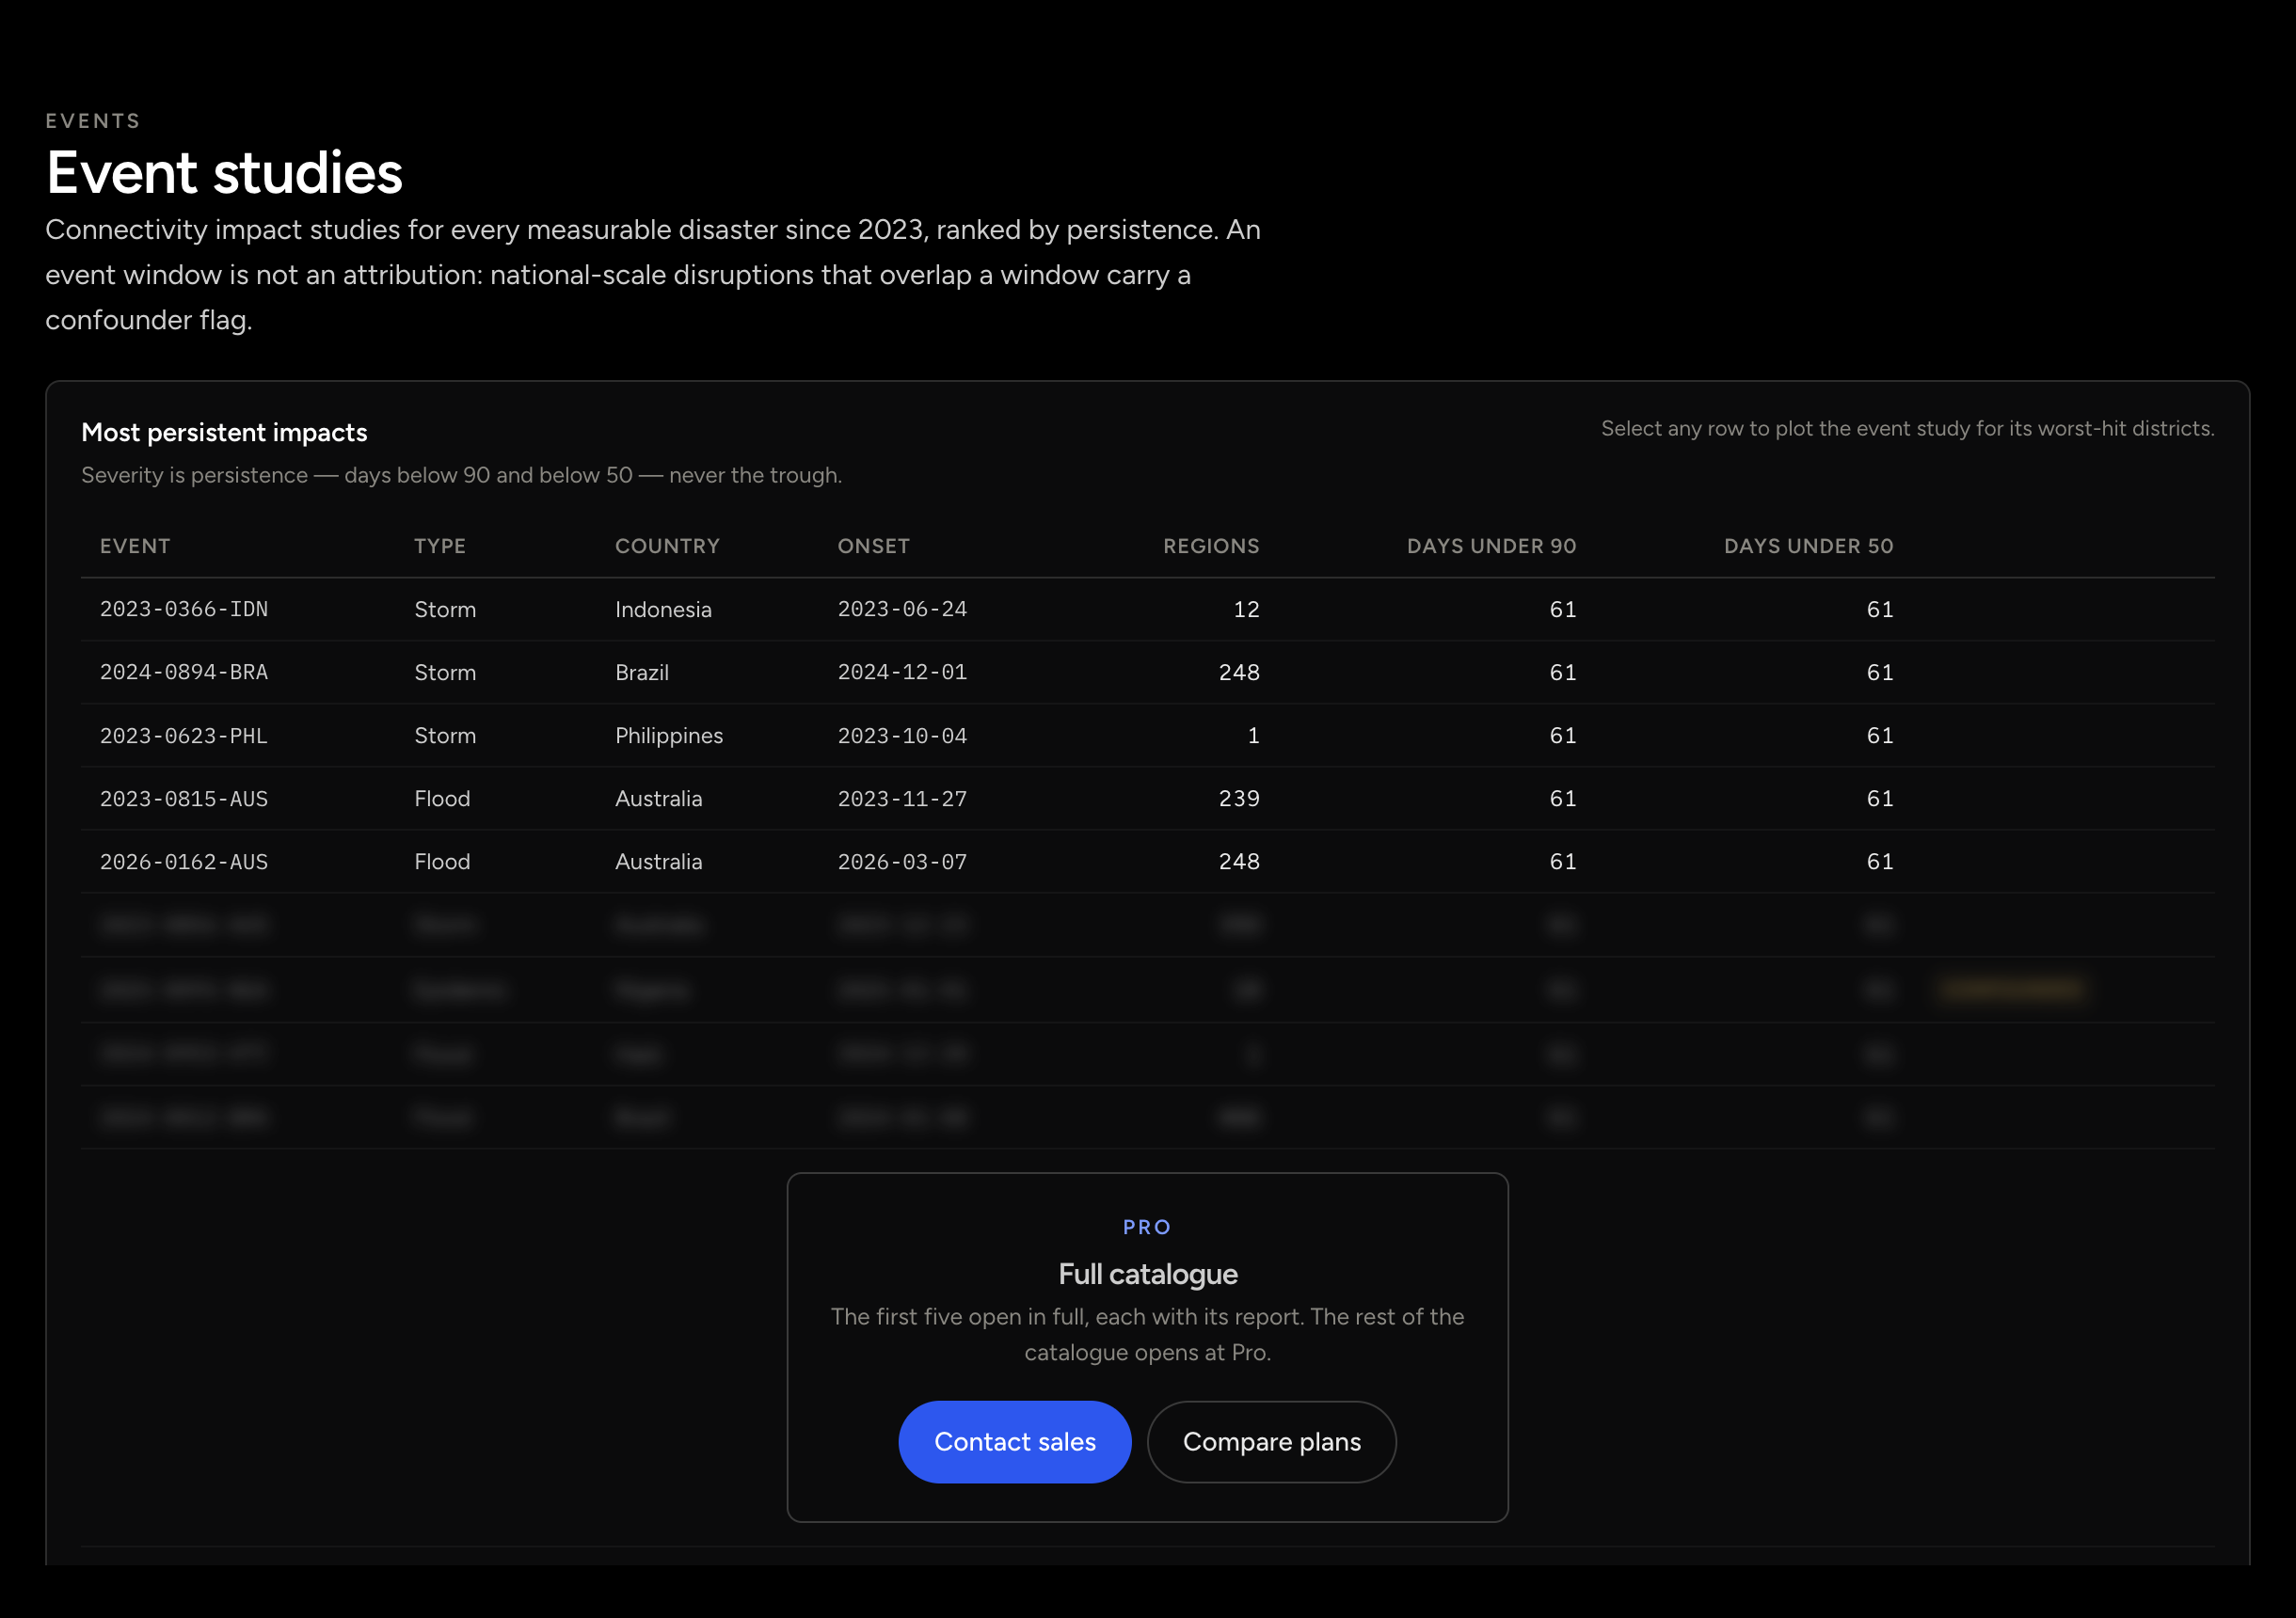
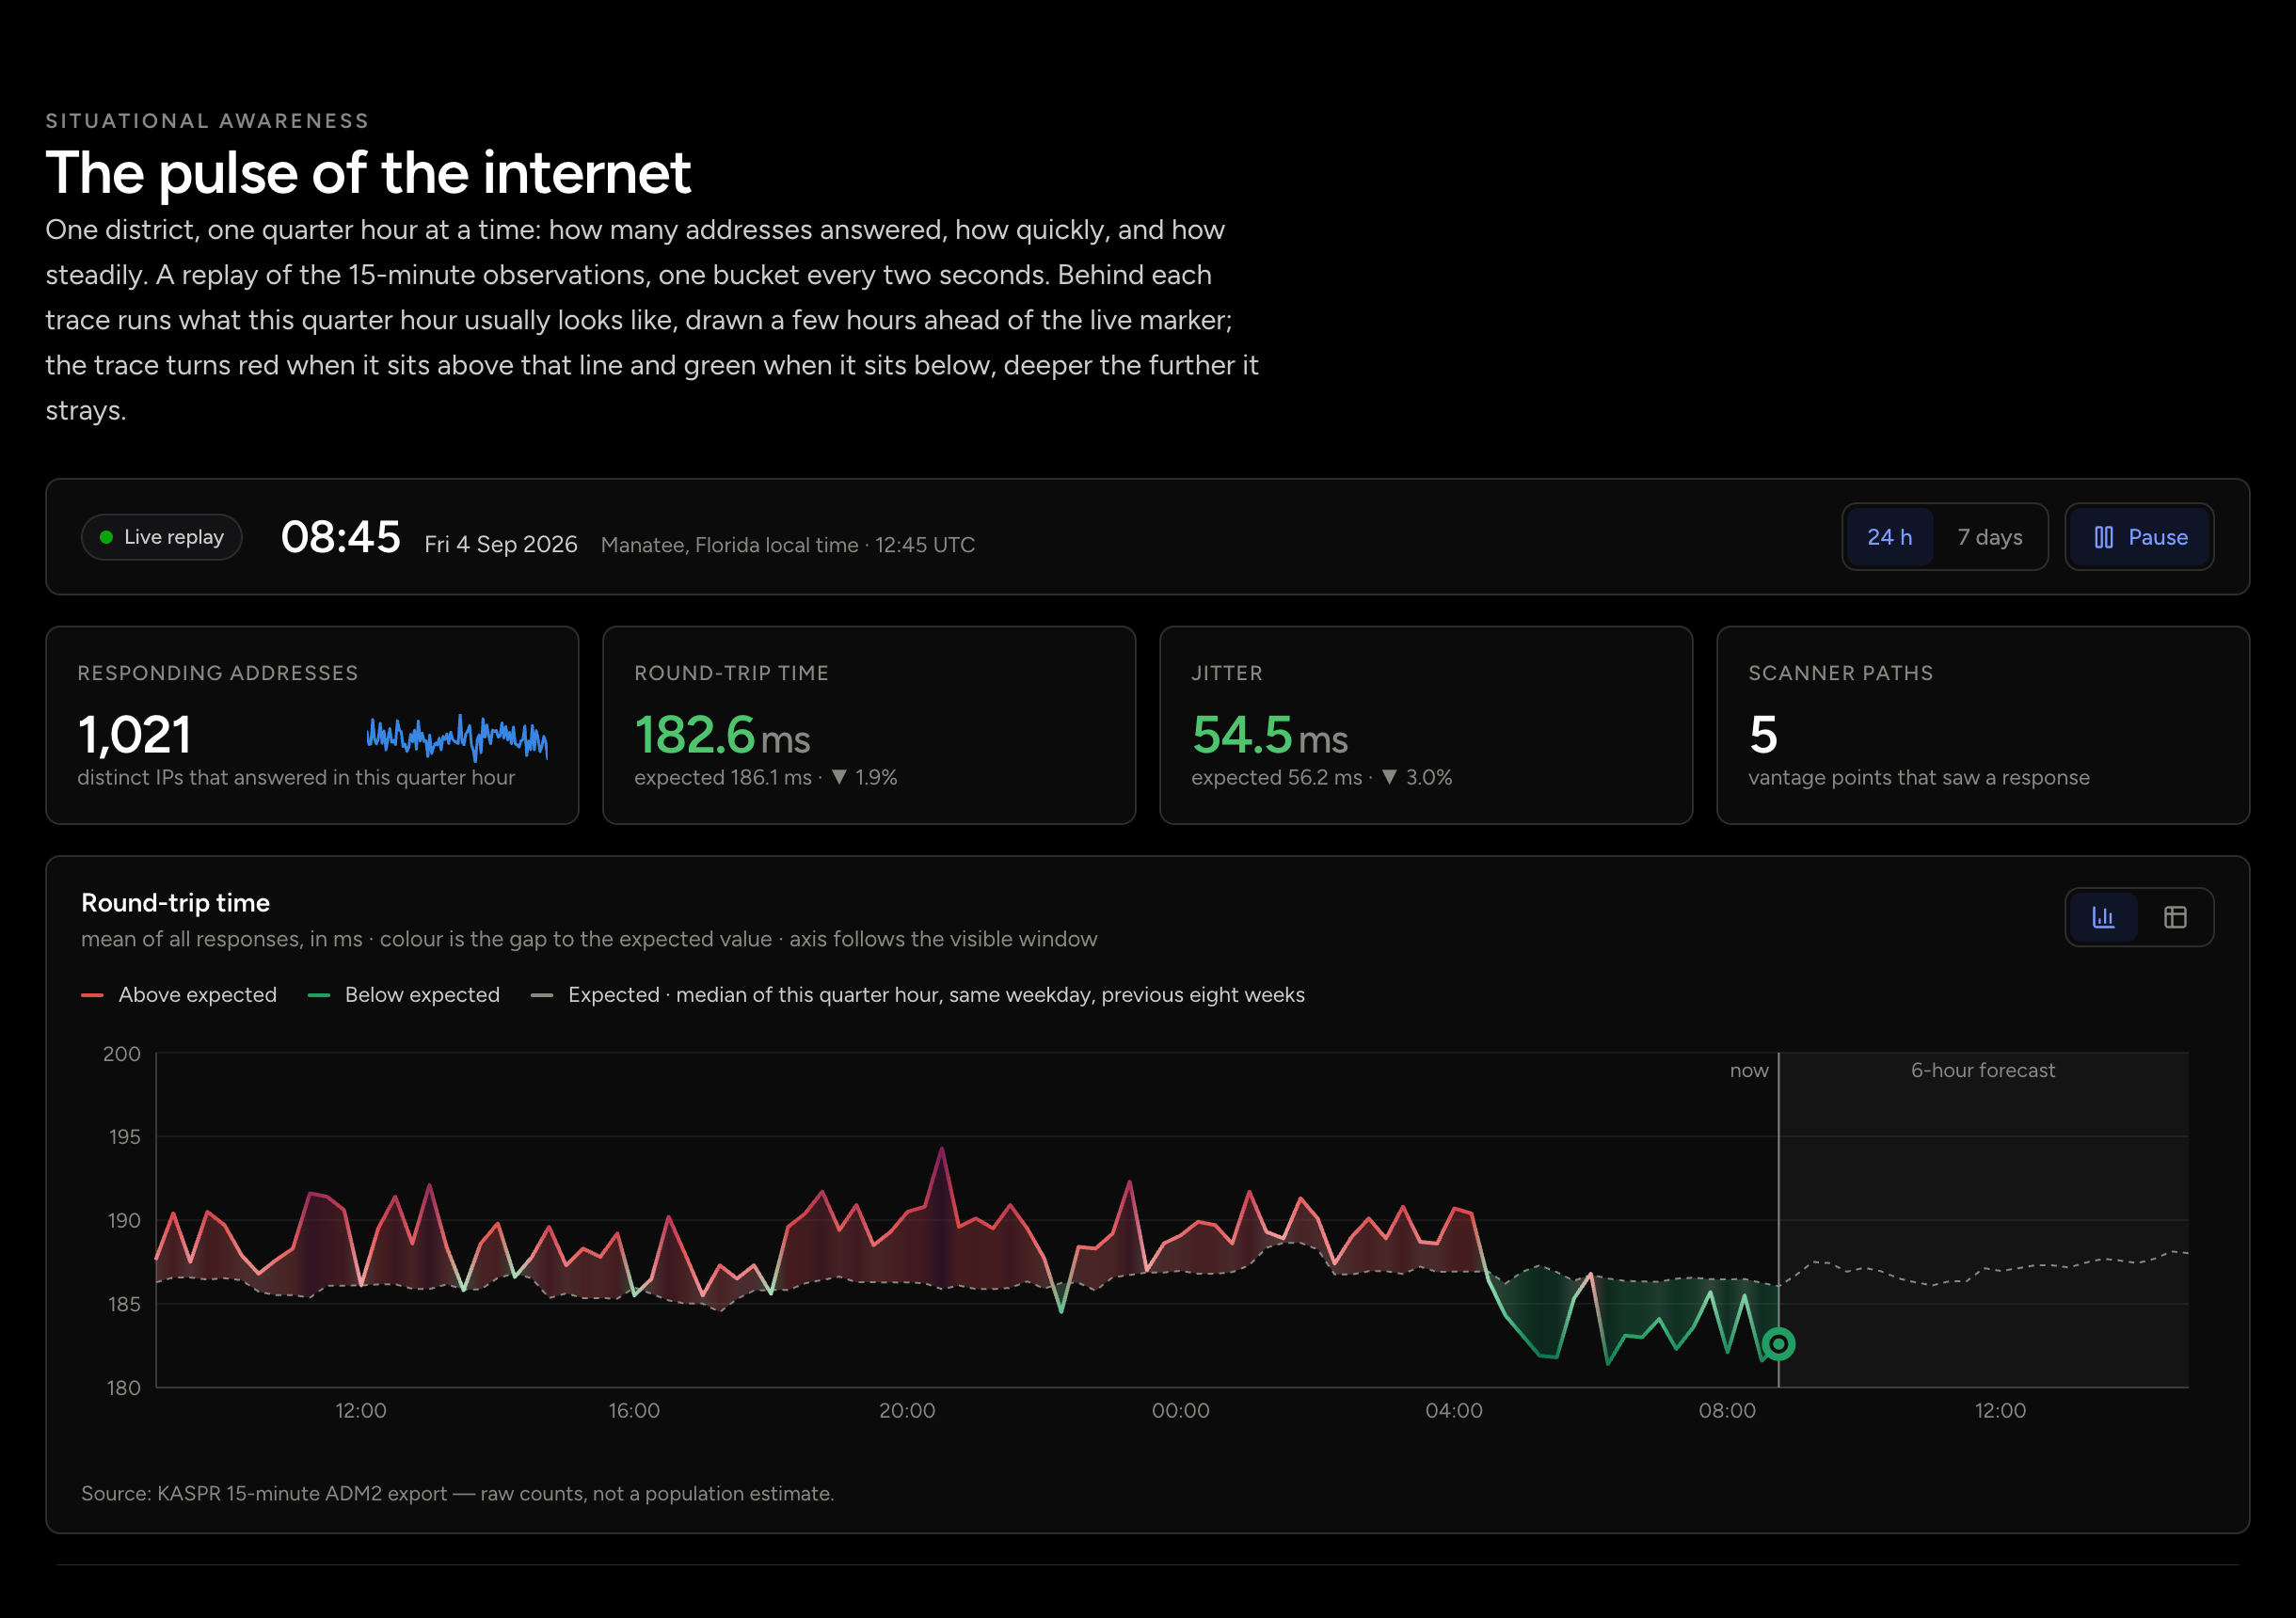
Alerts open when a district’s hour falls outside its own 99.9% band. Events match outages to the disaster record, with the index trace around each. Live replays one district’s quarter hours against what that hour usually looks like.
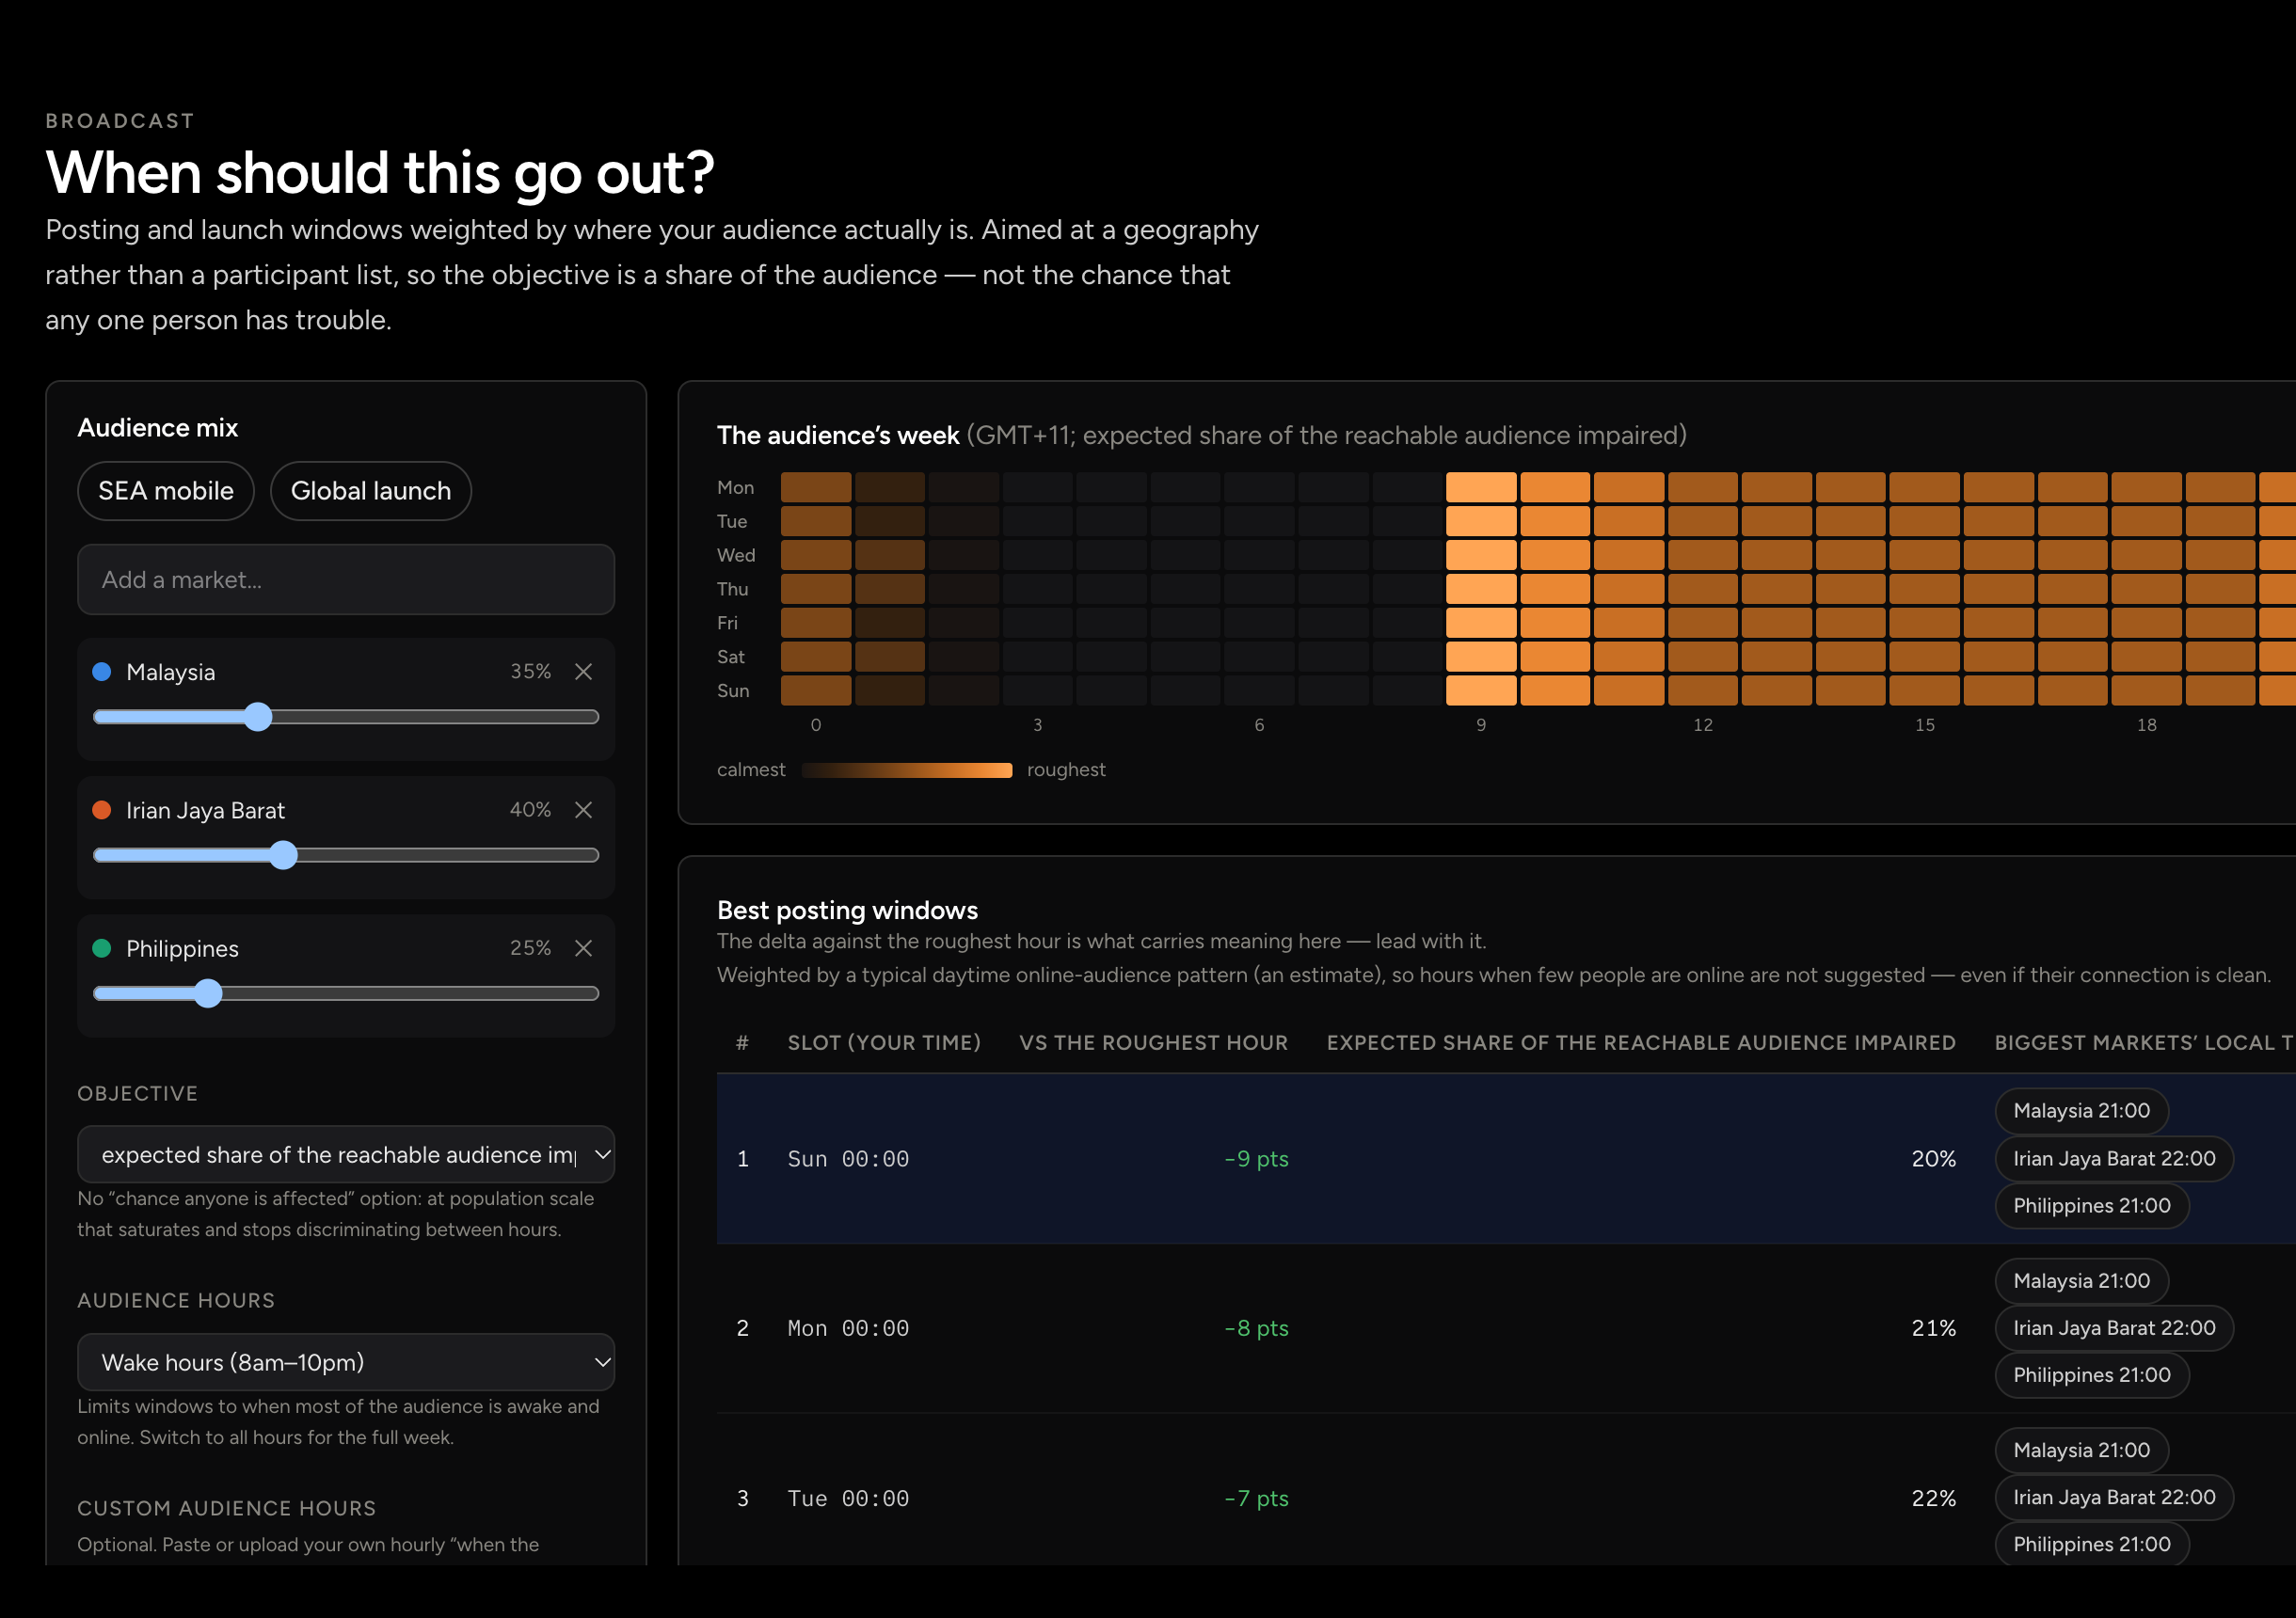
Predicted internet quality by hour, and the best time to schedule.
Predict & Schedule
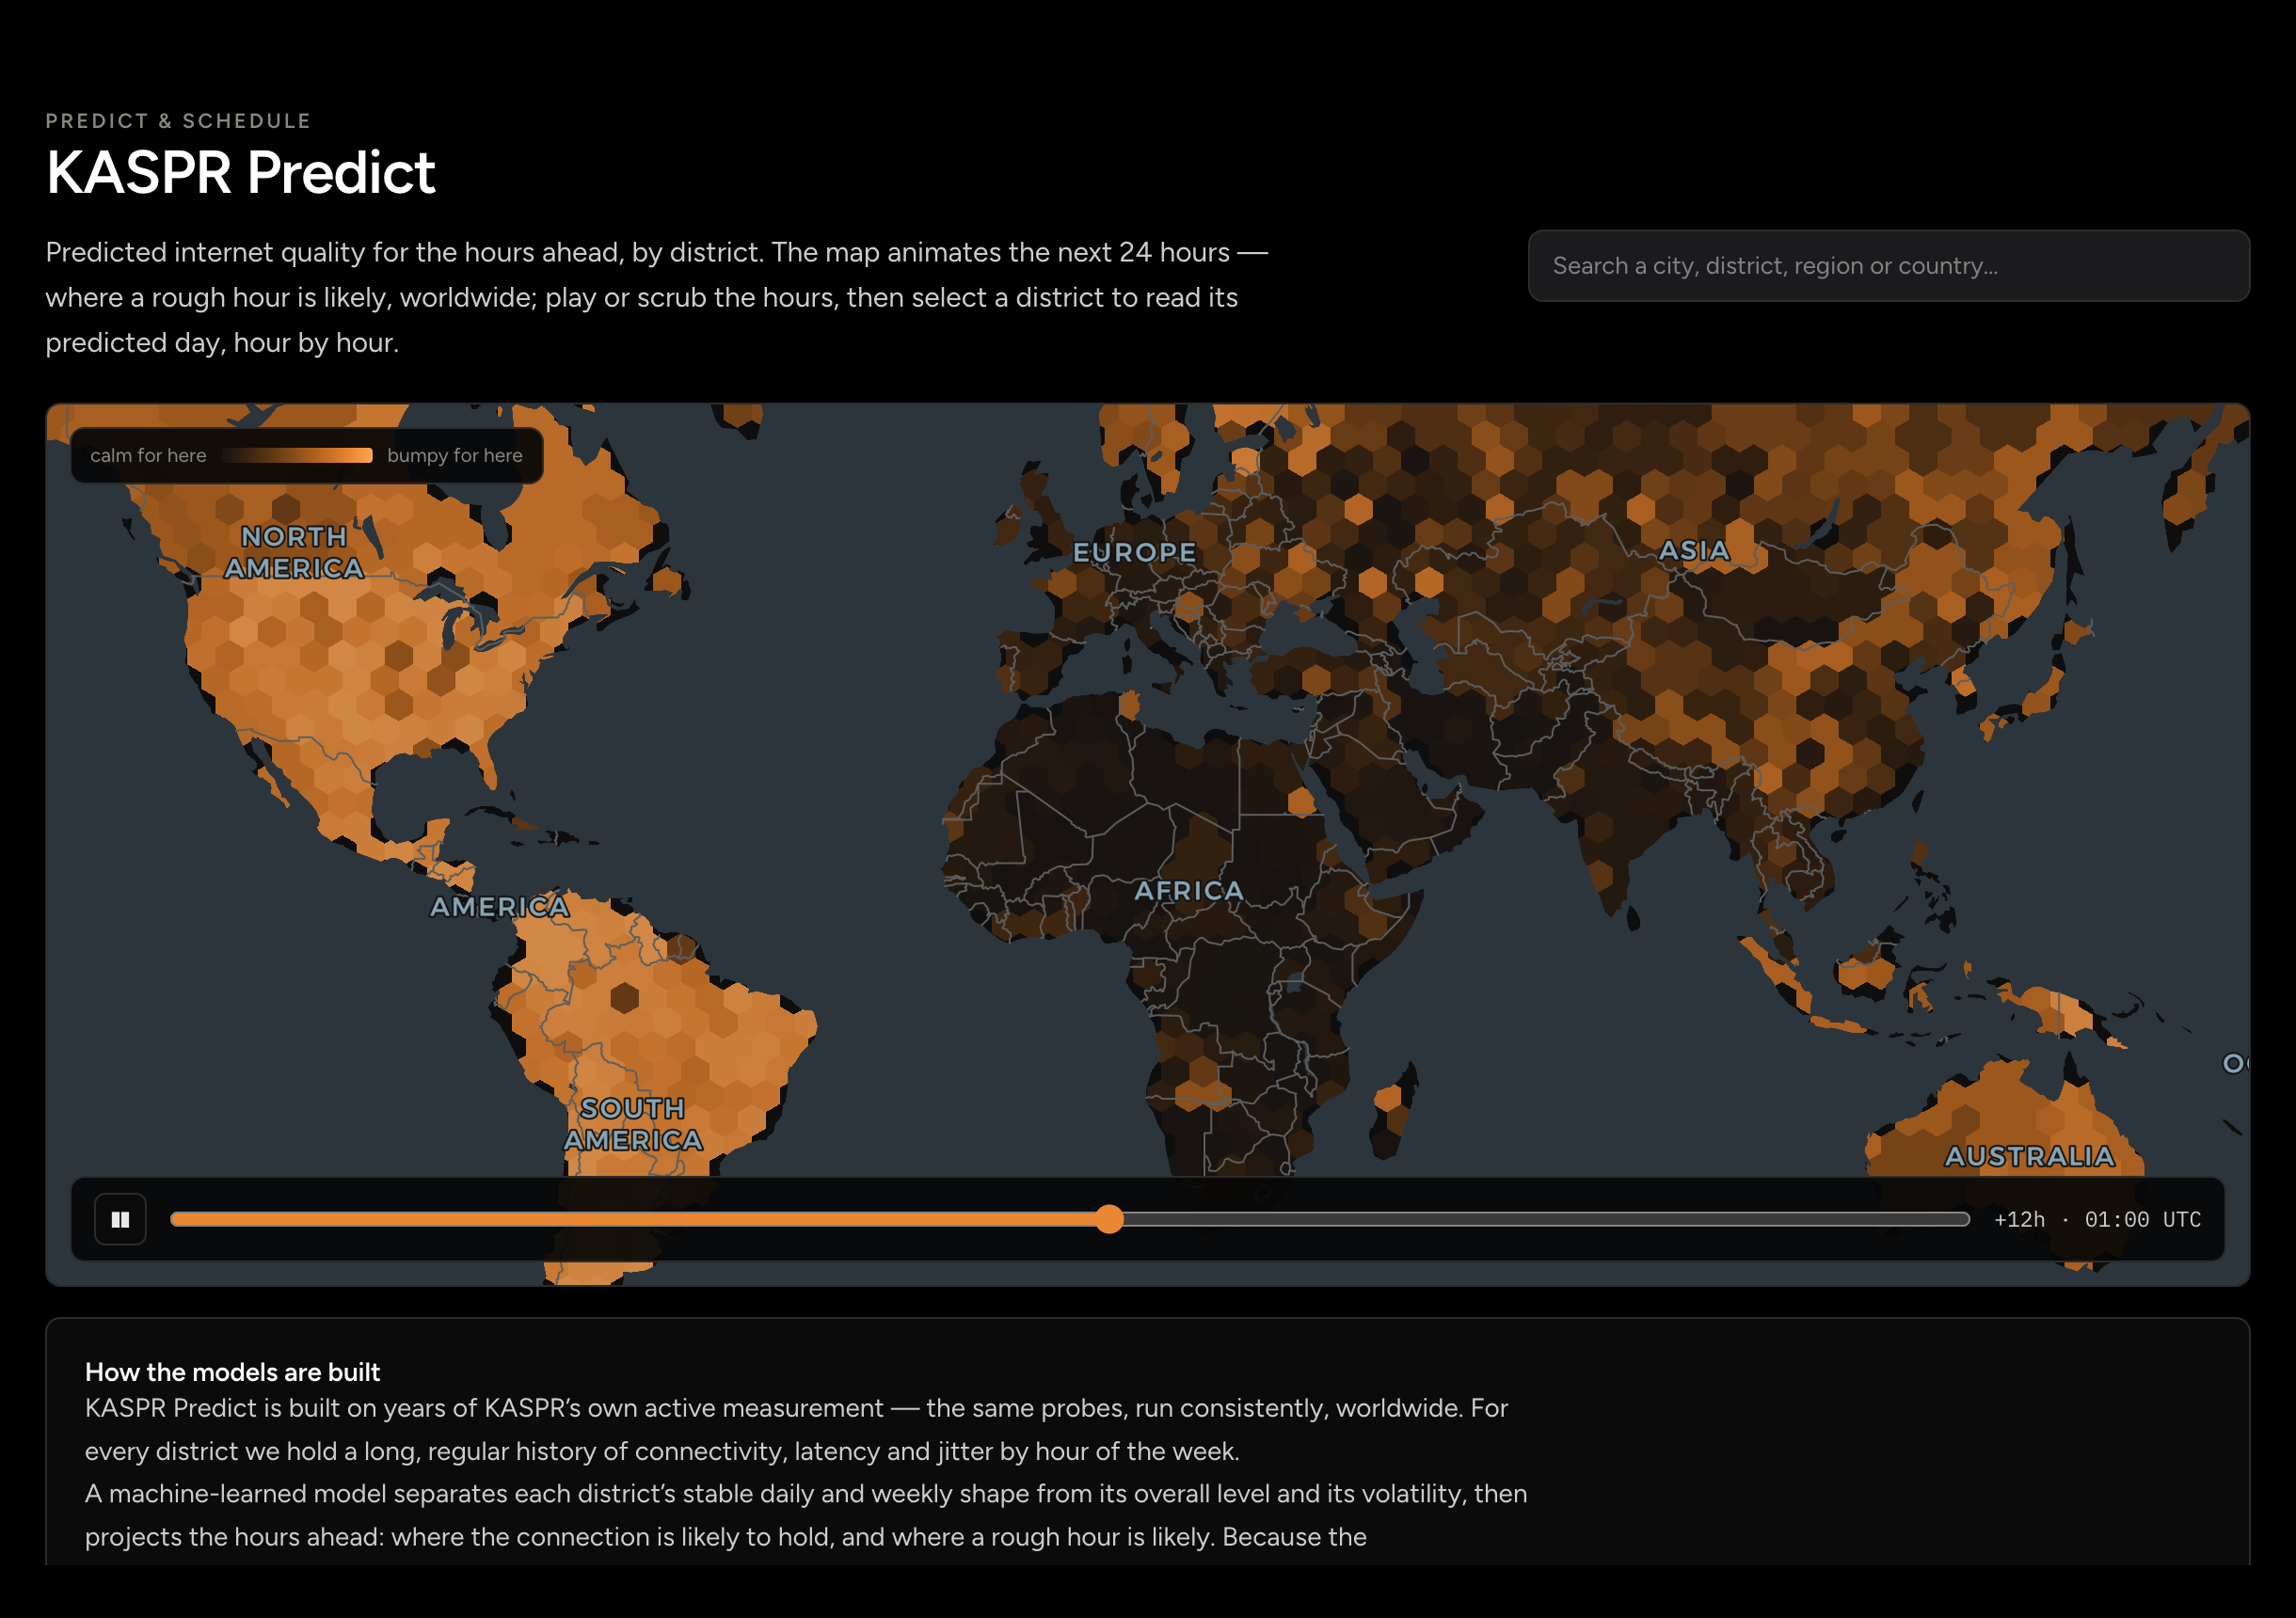
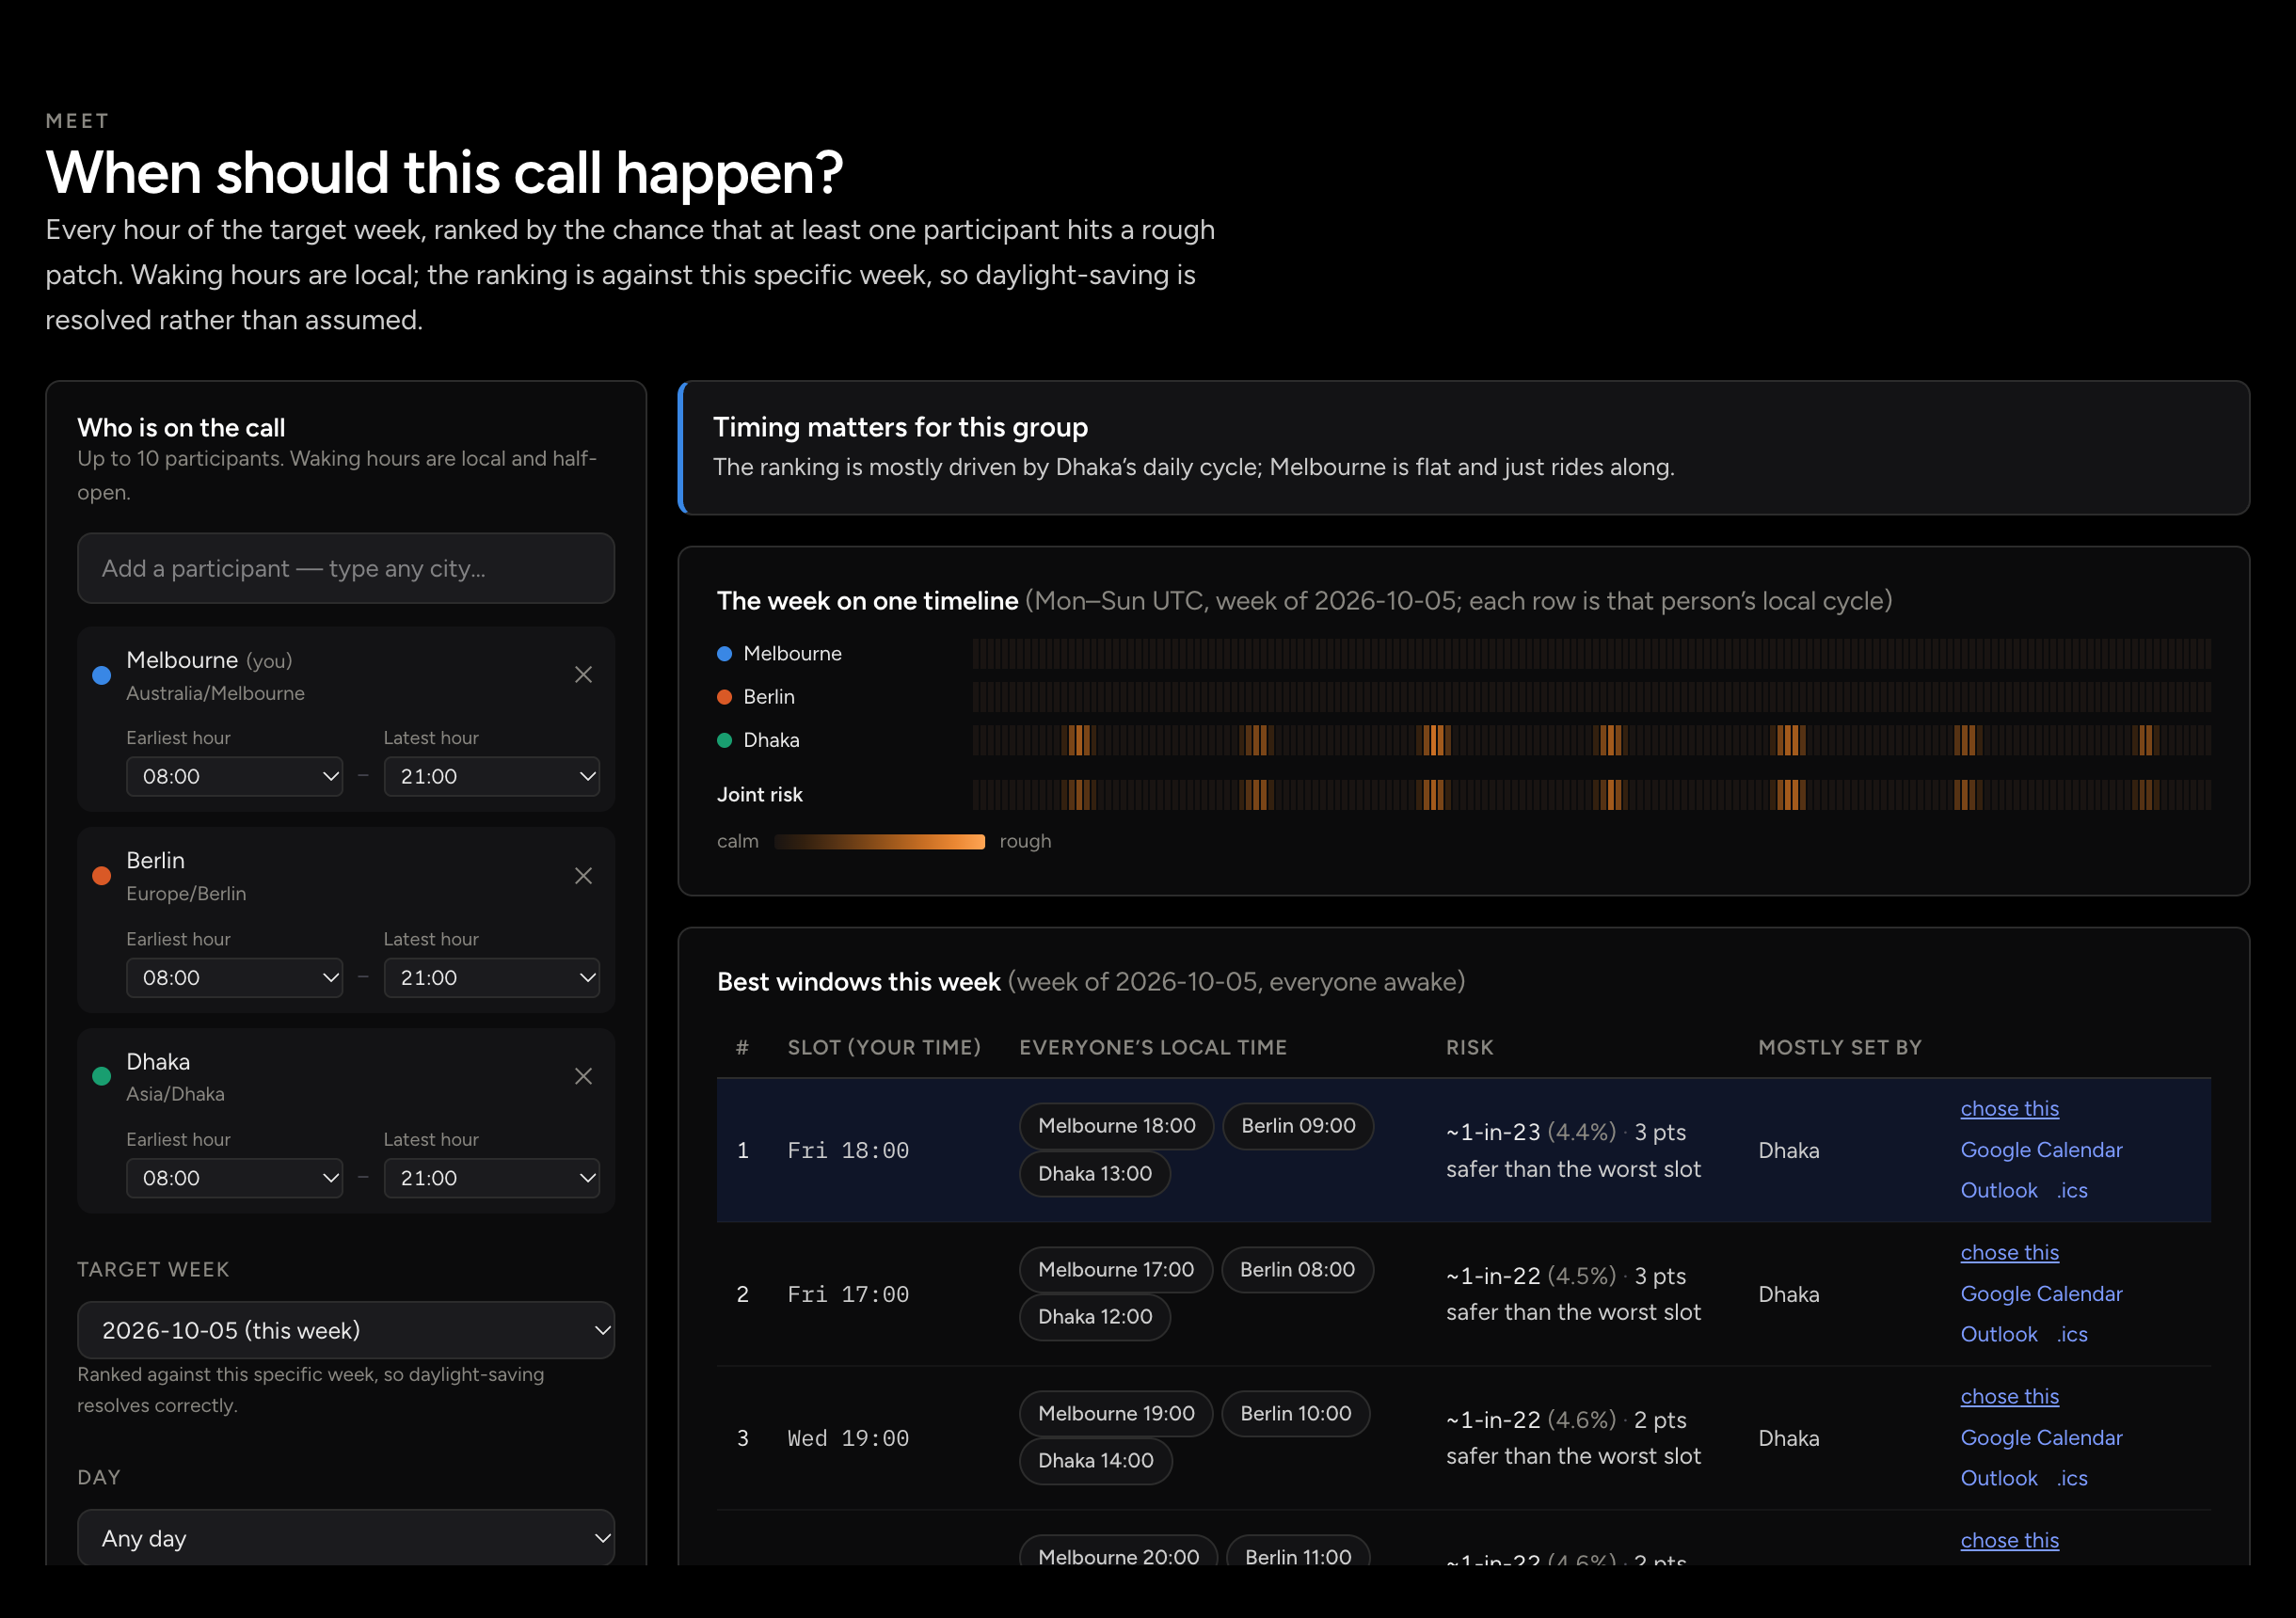
Predict points the model at the hours ahead: where a rough hour is likely, district by district. Meet ranks the hours of a call across every participant’s place; Broadcast ranks the hours of a post or launch across an audience mix.
The planning tools are also a standalone app, KASPR Schedule, which plans calls and posts on the same data.
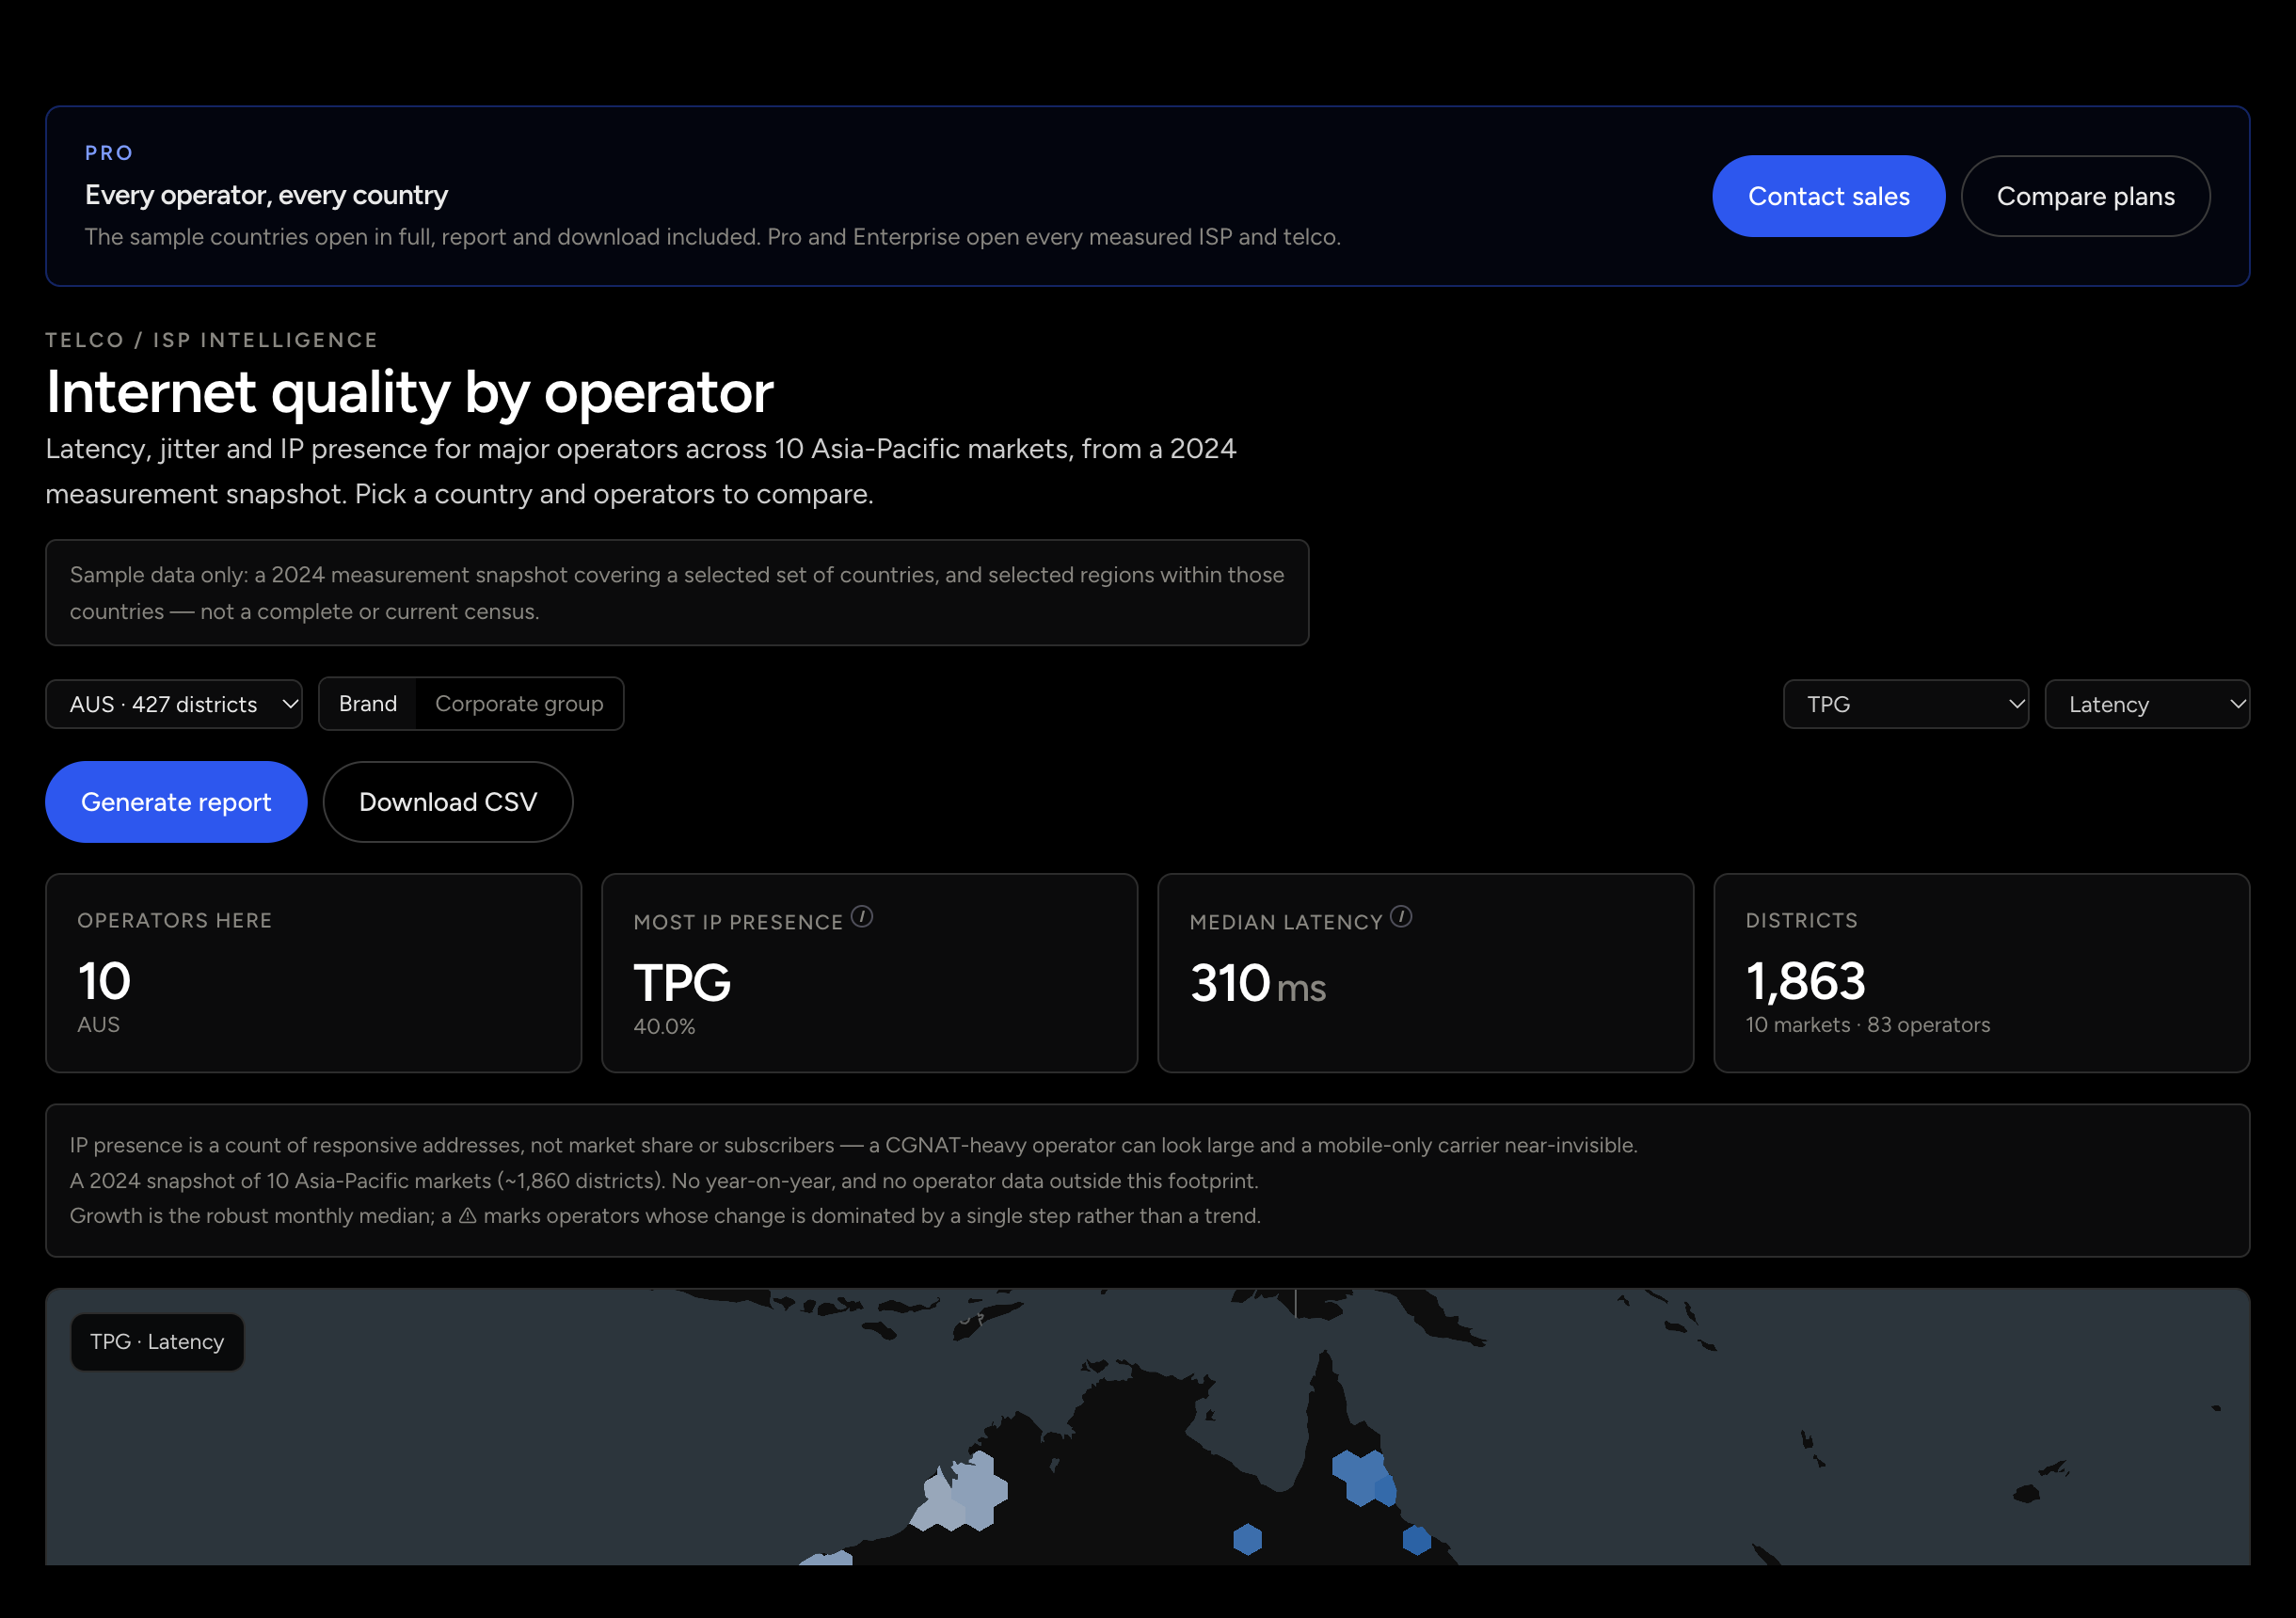
Internet quality by operator, where the data reaches.
Telco / ISP
Latency, jitter and IP presence by operator across ten Asia-Pacific markets from a 2024 measurement snapshot: pick a country, then the operators to compare.
Six pitches for regulators, vendors, operators, programmes, newsrooms and utilities, each with a worked data view from the measurement.
Public Sector & Regulators
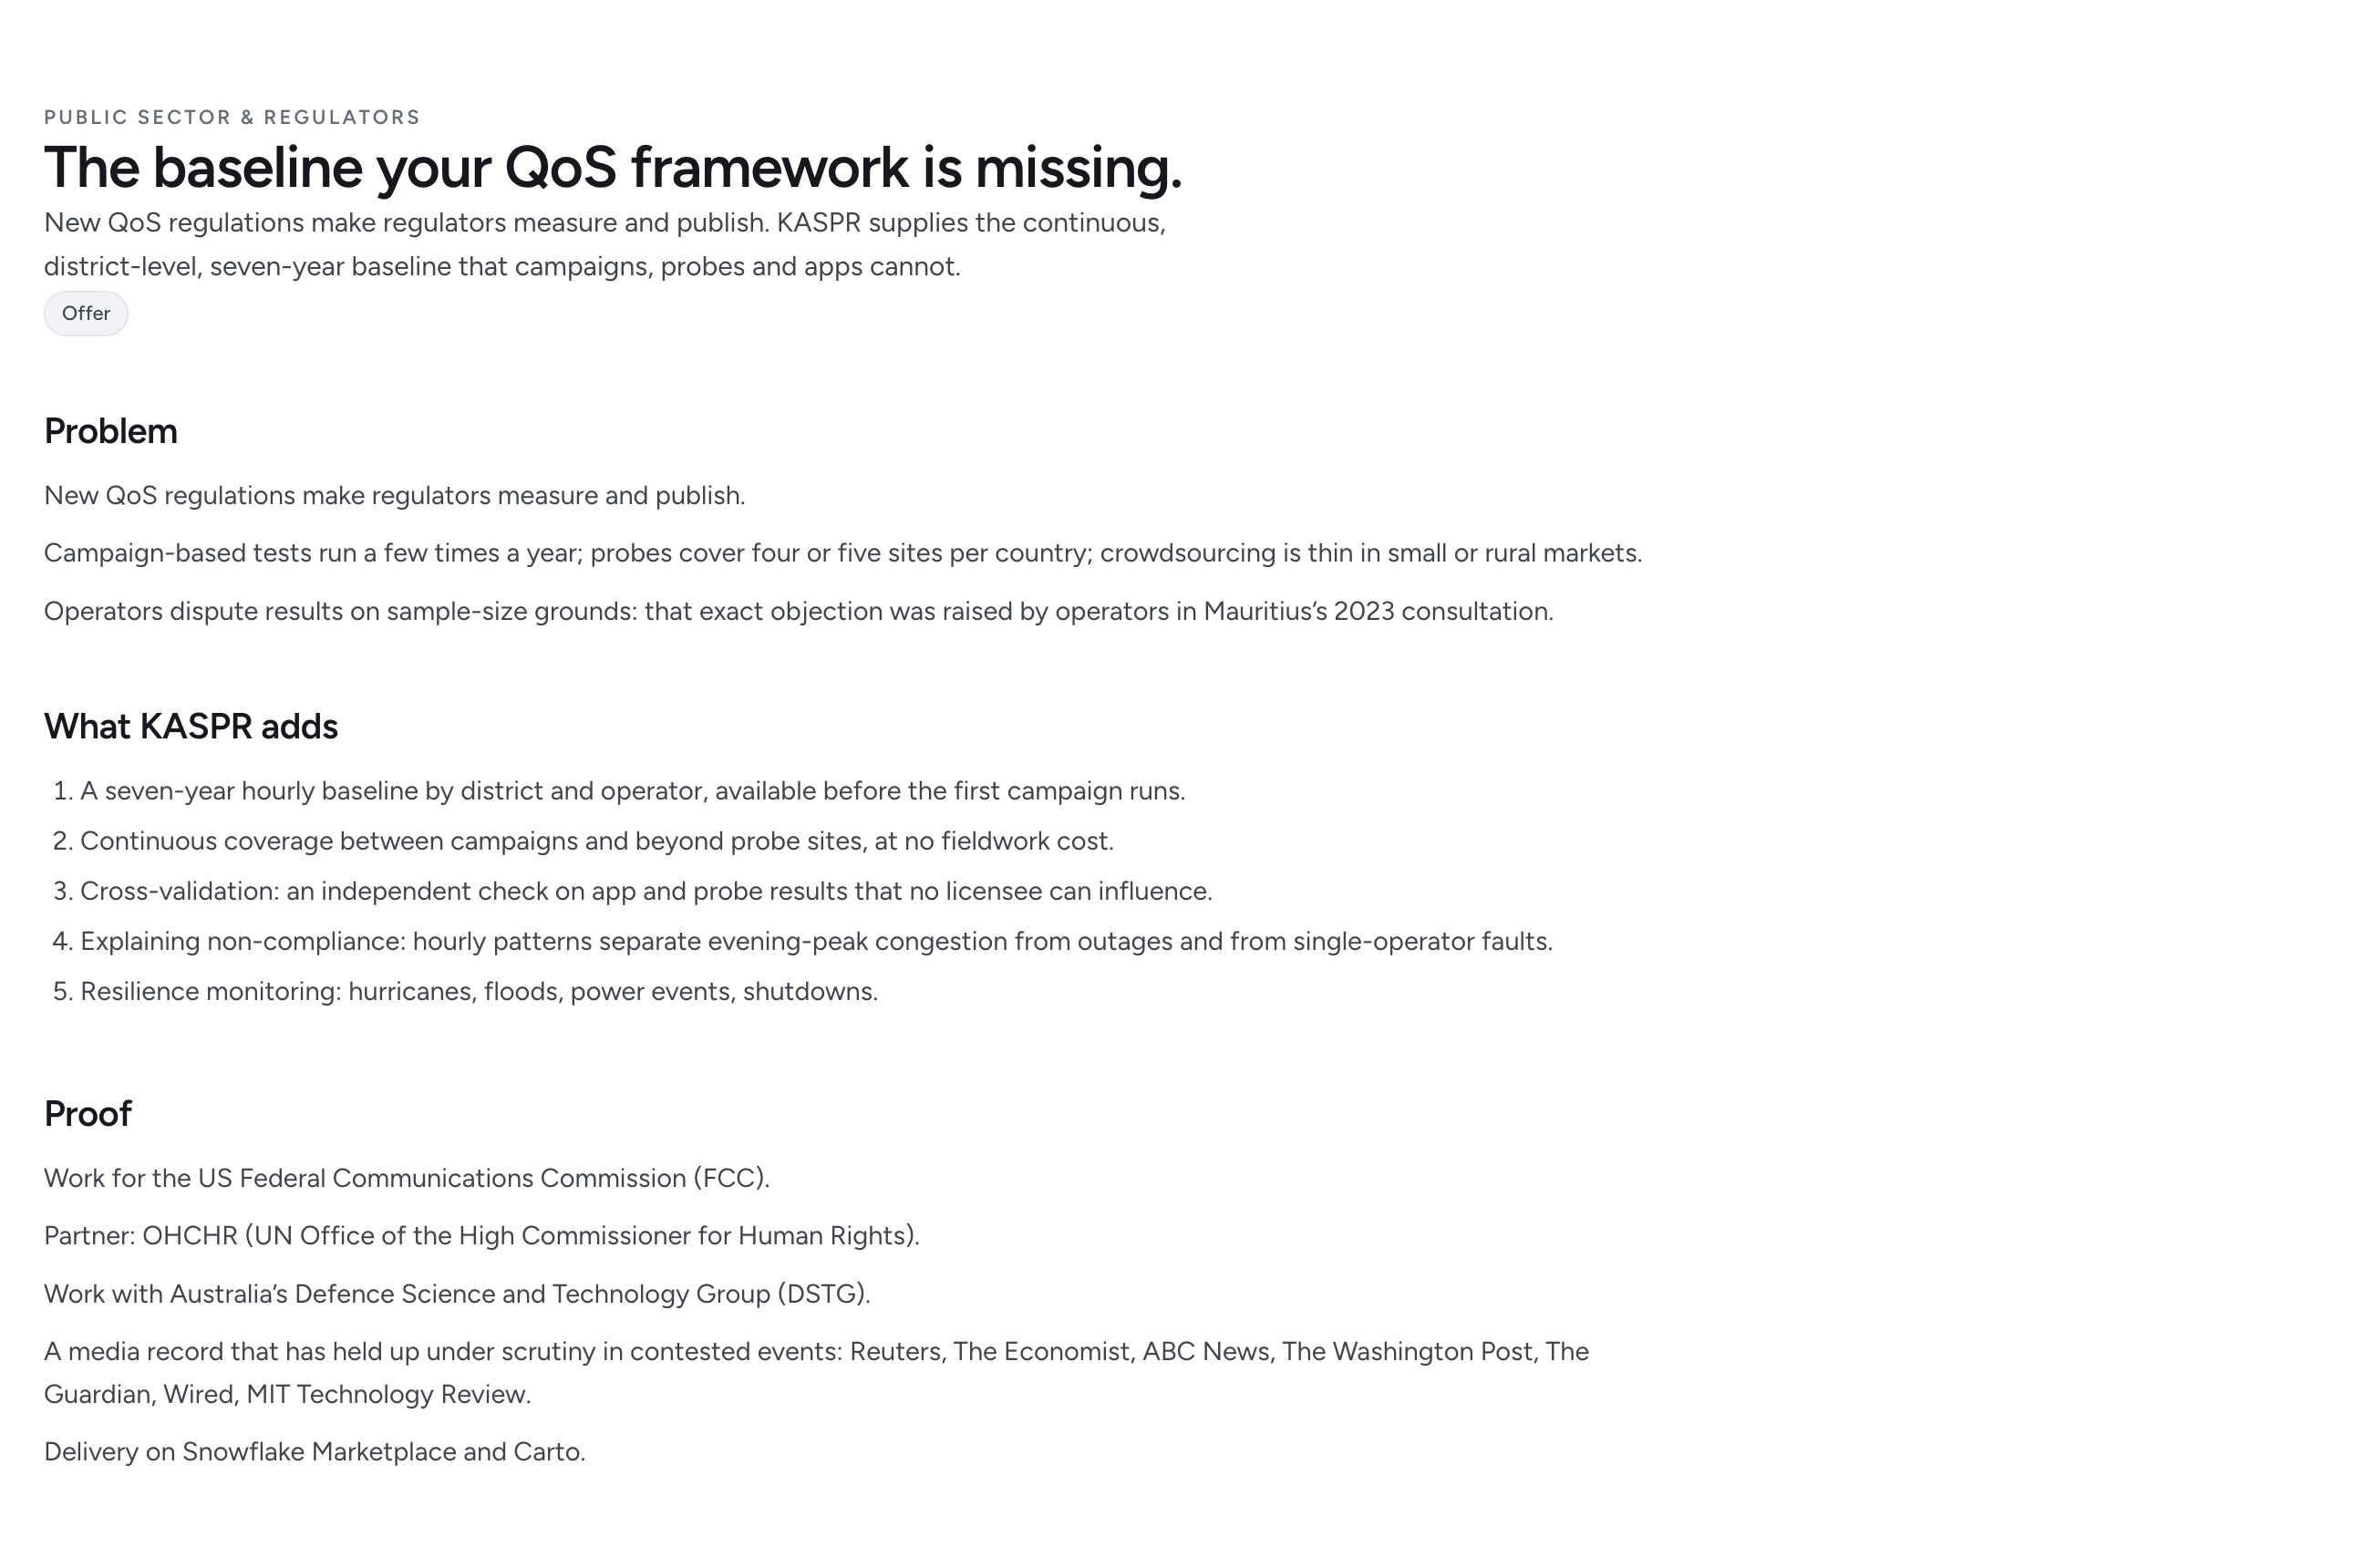
The baseline your QoS framework is missing.
New QoS regulations make regulators measure and publish. KASPR supplies the continuous, district-level, seven-year baseline that campaigns, probes and apps cannot.
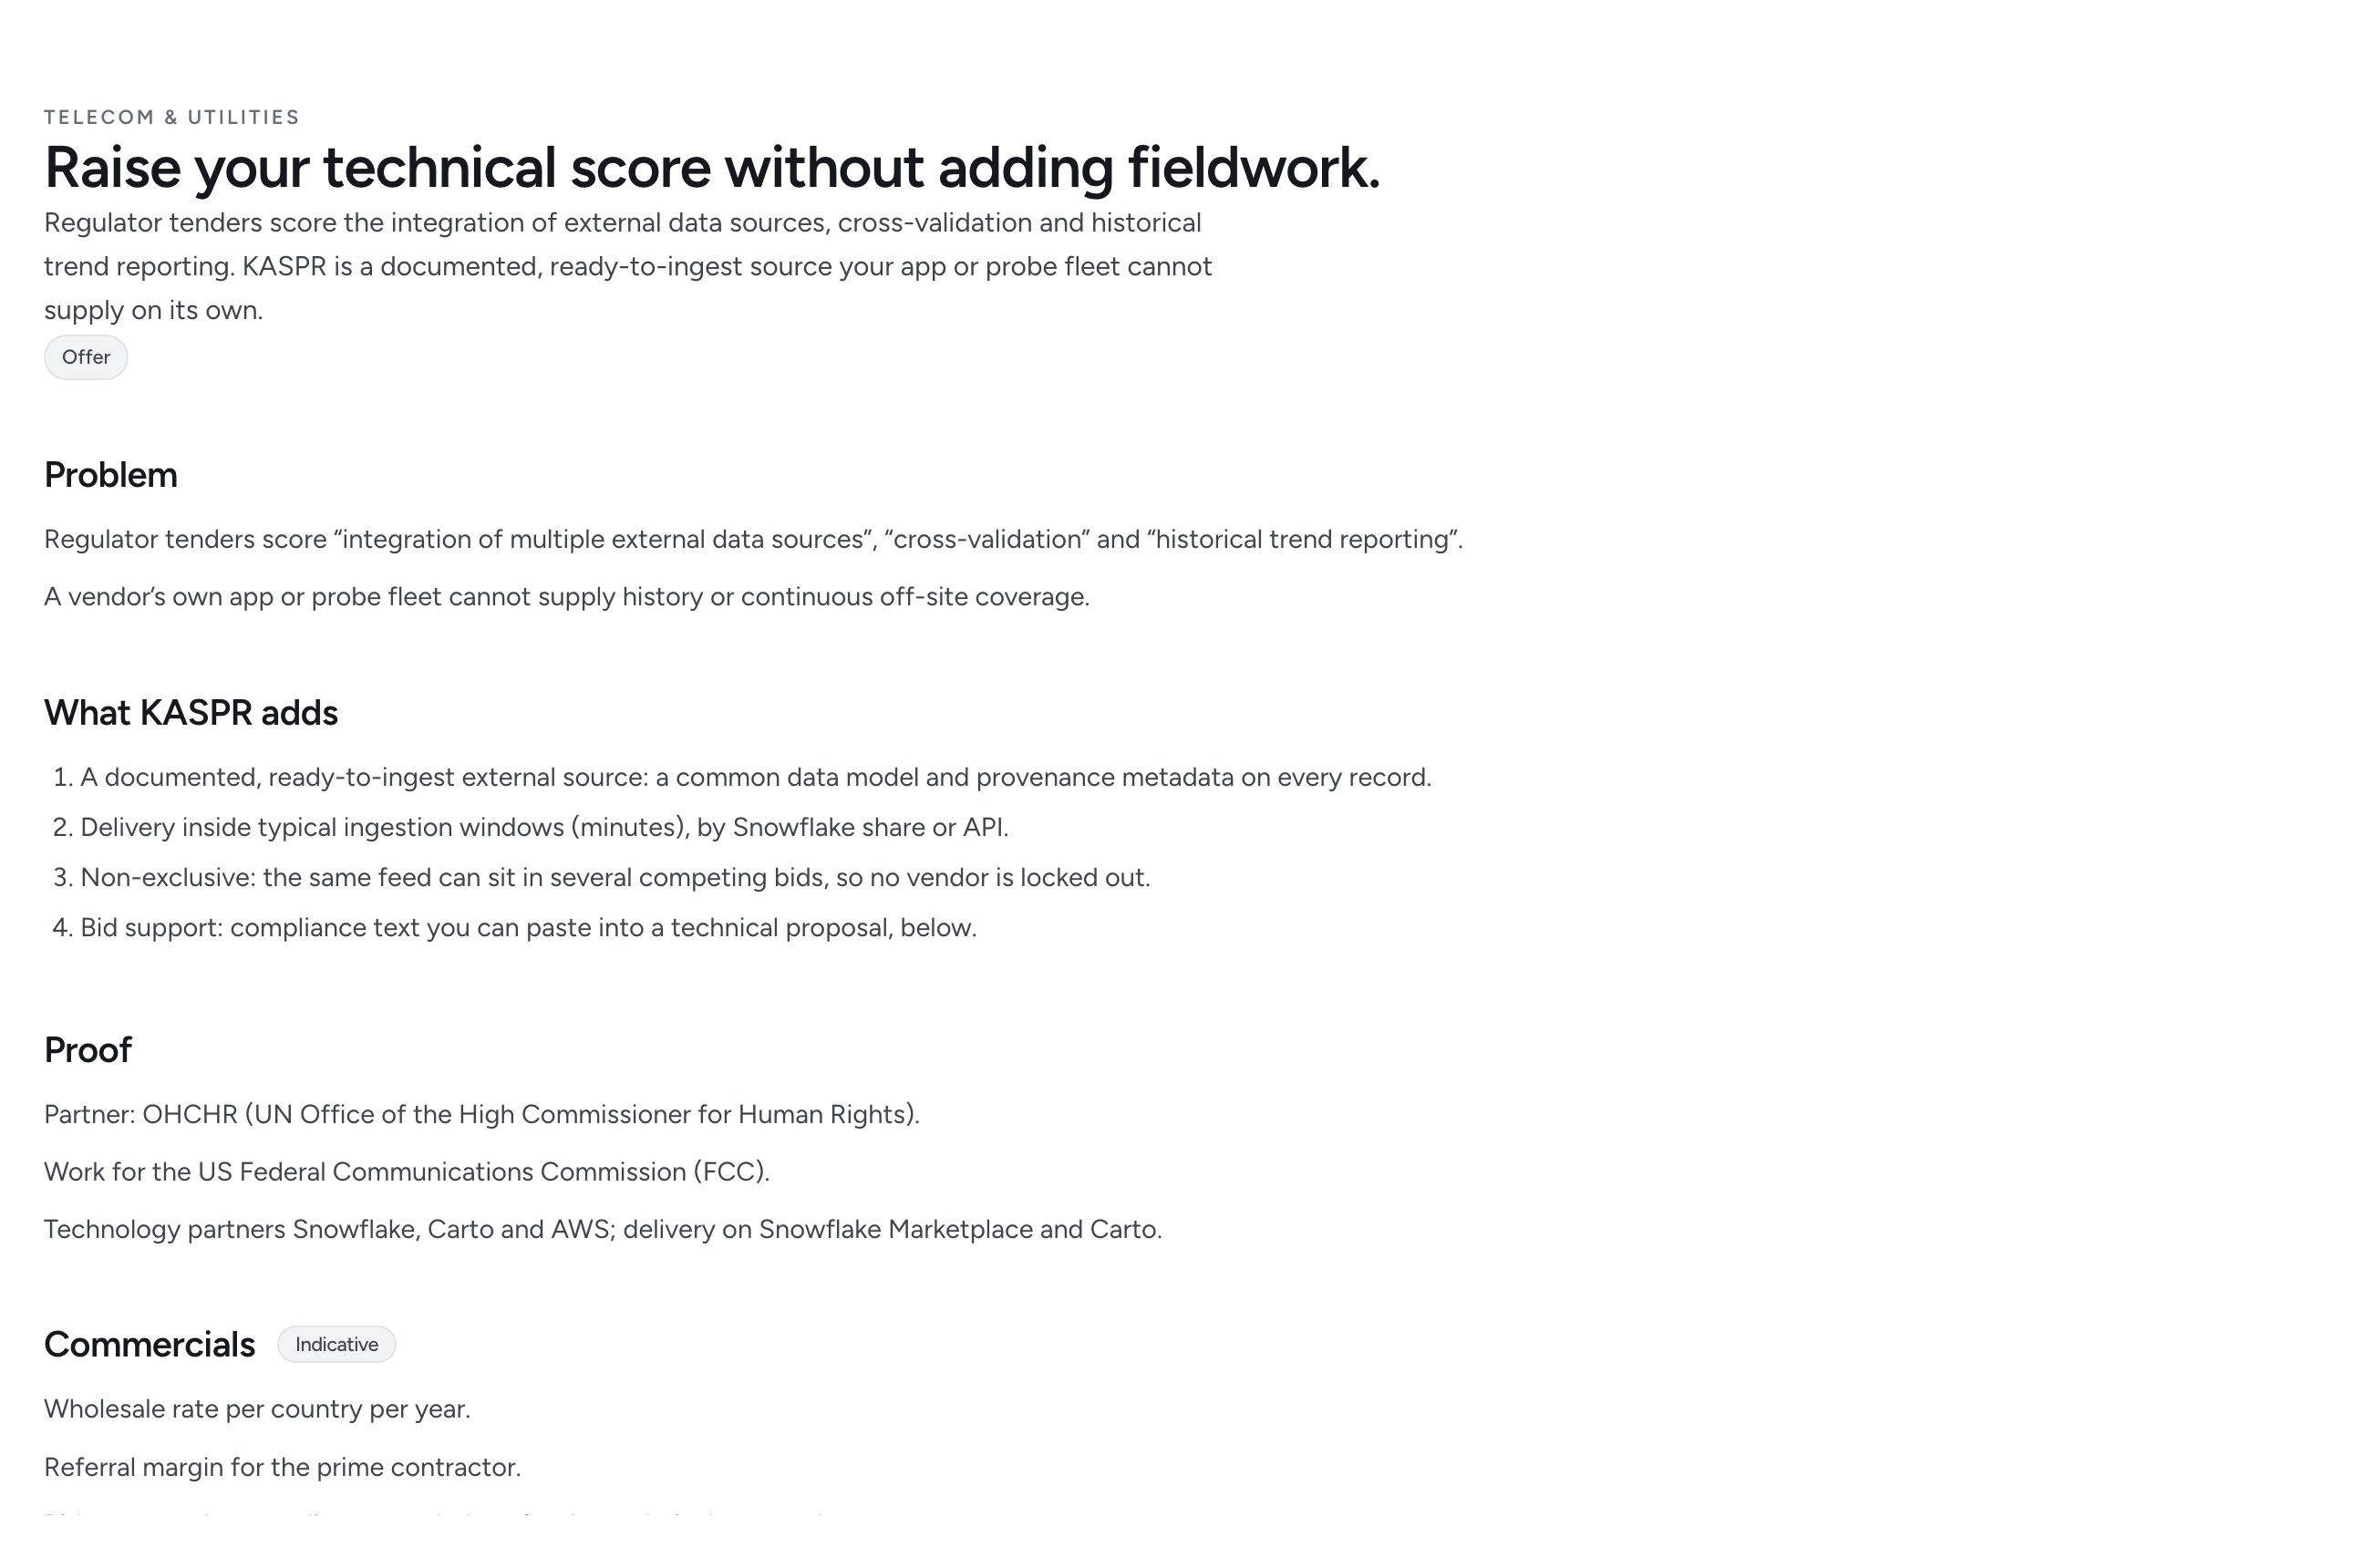
Raise your technical score without adding fieldwork.
Regulator tenders score the integration of external data sources, cross-validation and historical trend reporting. KASPR is a documented, ready-to-ingest source your app or probe fleet cannot supply on its own.
A regional connectivity record for every country in the programme.
Digital transformation projects fund regulators to build QoS capacity, with no baseline to measure progress against. One licence, one method, history back to 2019, for every country in the programme.
Our existing, provable trust story: the stories below used KASPR data on events where the facts were contested. They are proof for every other reader that the data holds up in public.
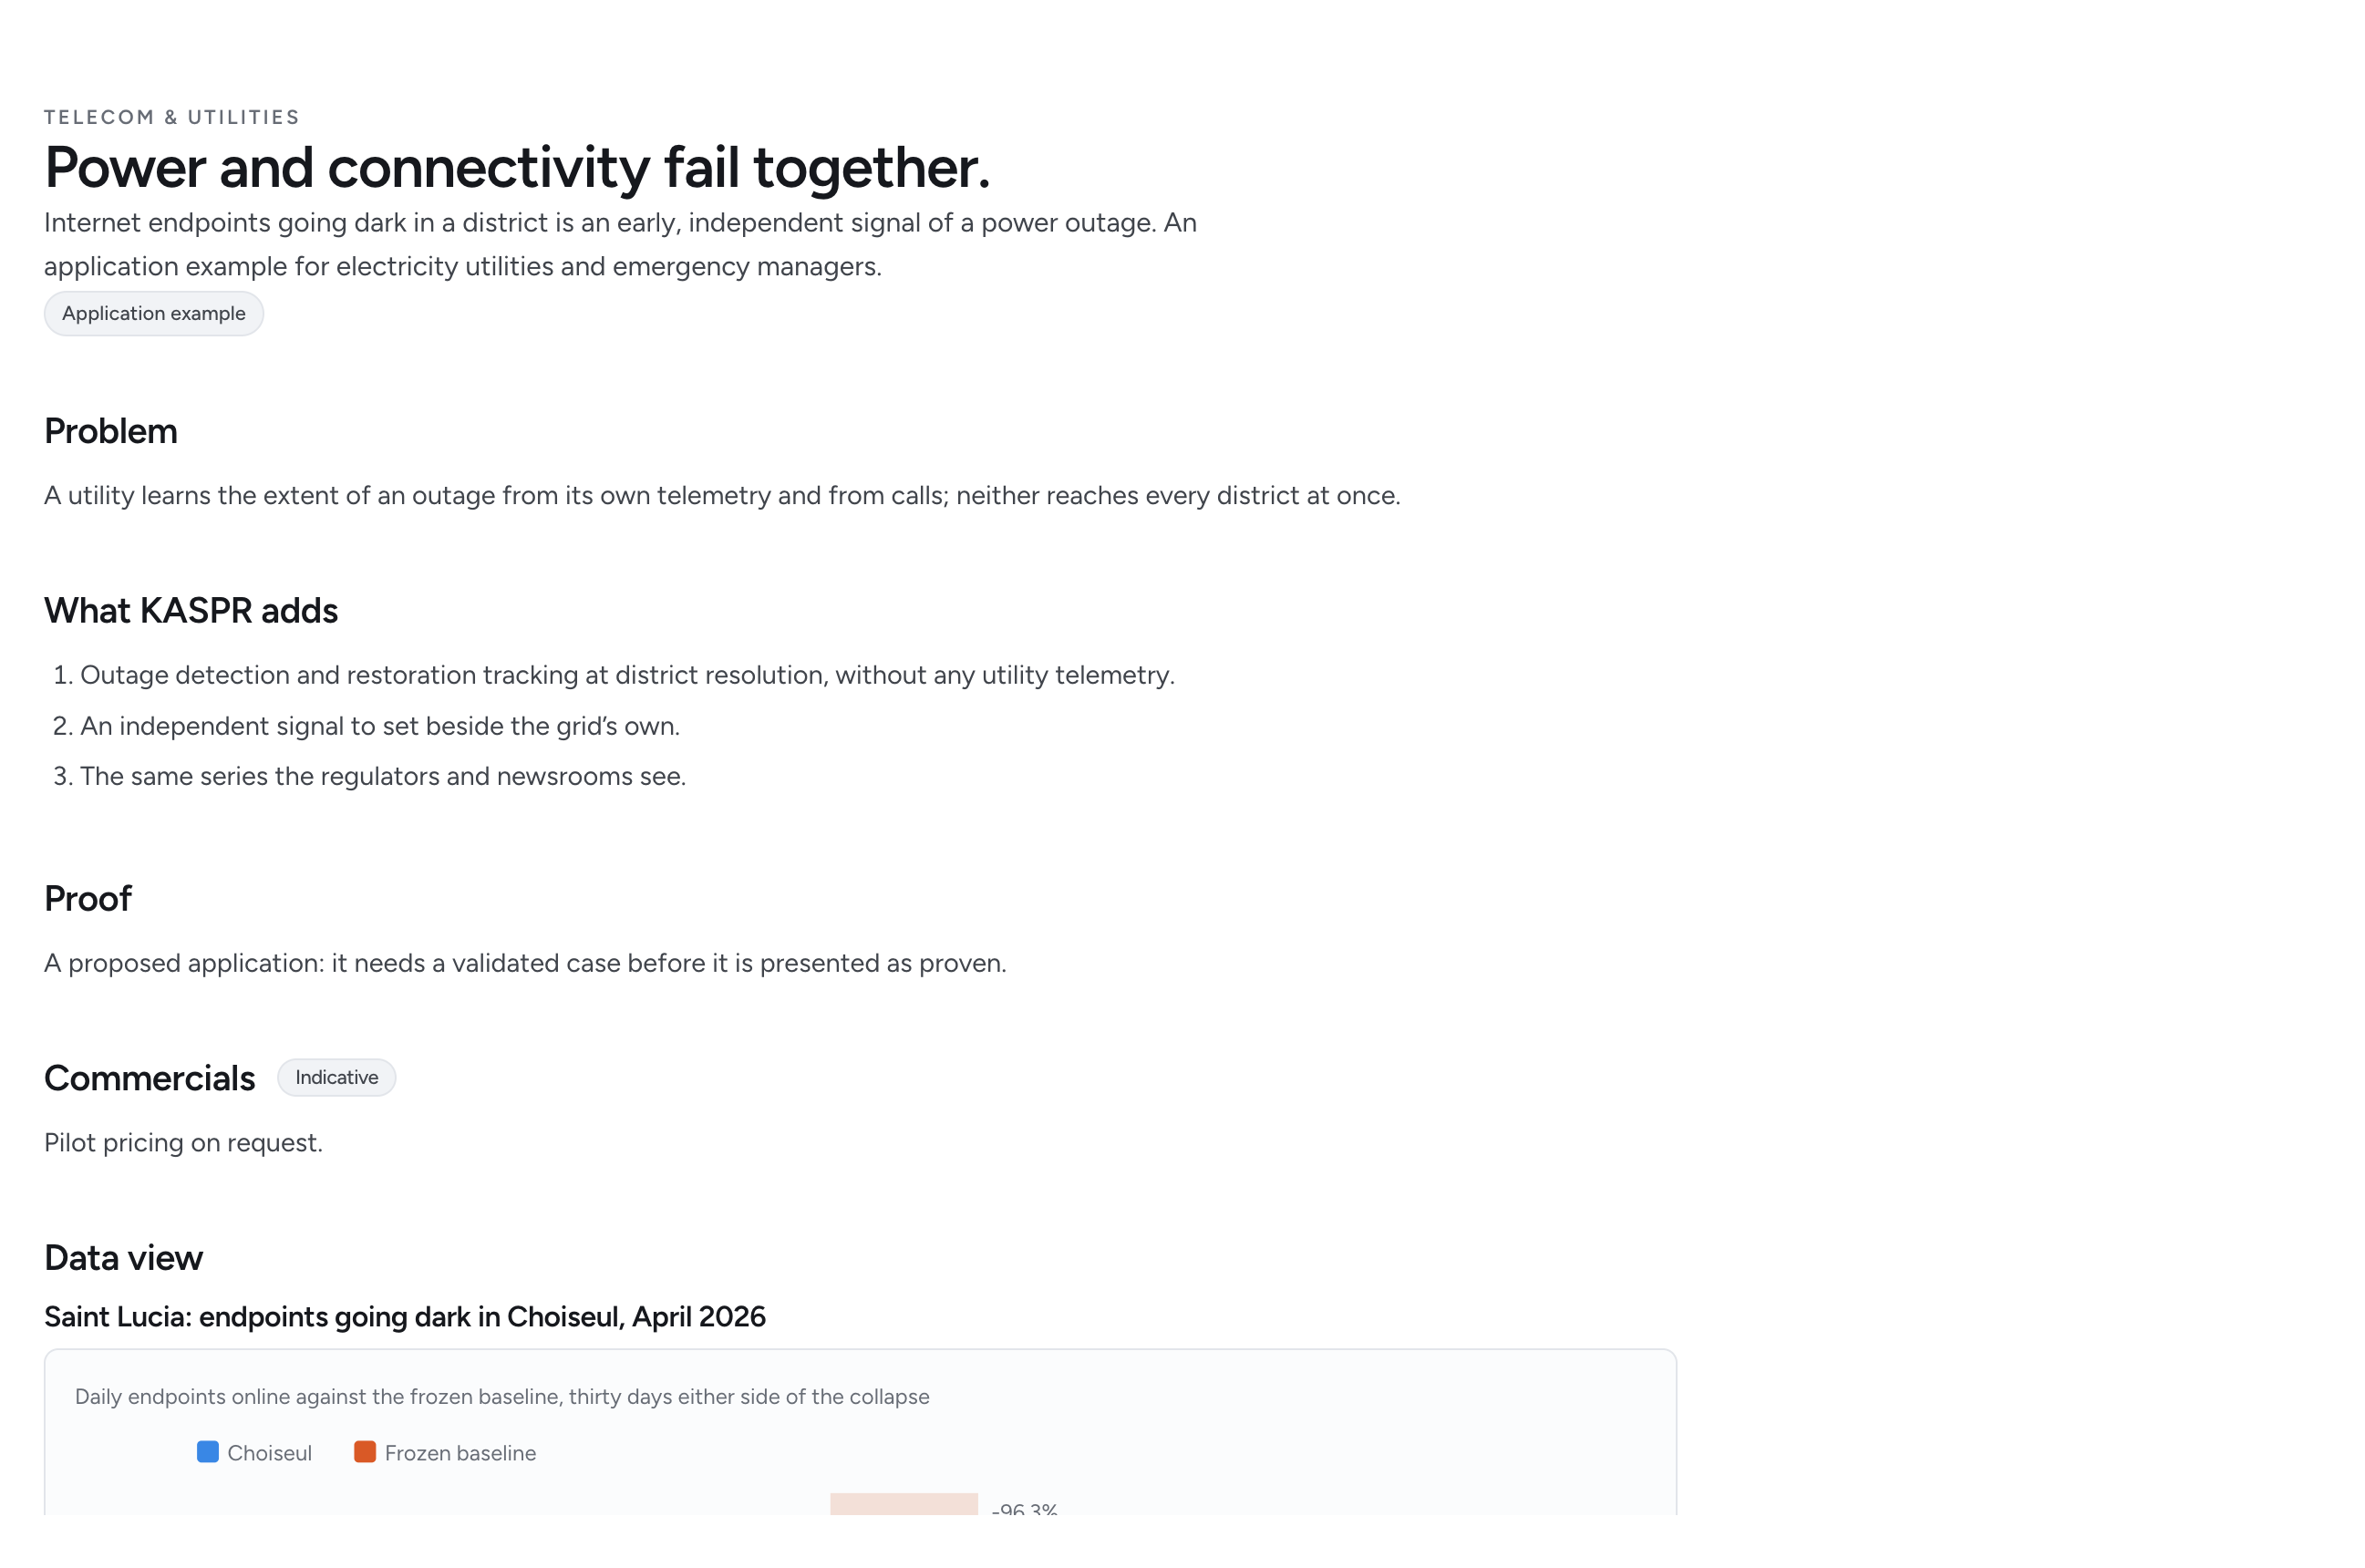
Internet endpoints going dark in a district is an early, independent signal of a power outage. An application example for electricity utilities and emergency managers.