KASPR Intelligence

Internet intelligence: monitor, predict, act.

Almost everything a company does now runs over someone else’s internet connection, in districts it has never measured. KASPR has measured internet quality across most of the world, district by district, every hour since February 2019. The dashboard turns that record into three moves: monitor the baseline where your assets, customers or audience are; predict which hours will run rough next week; and act, with alerts when a district breaks and ranked windows for meetings and launches.

Manatee County, Florida · live replay

What it does

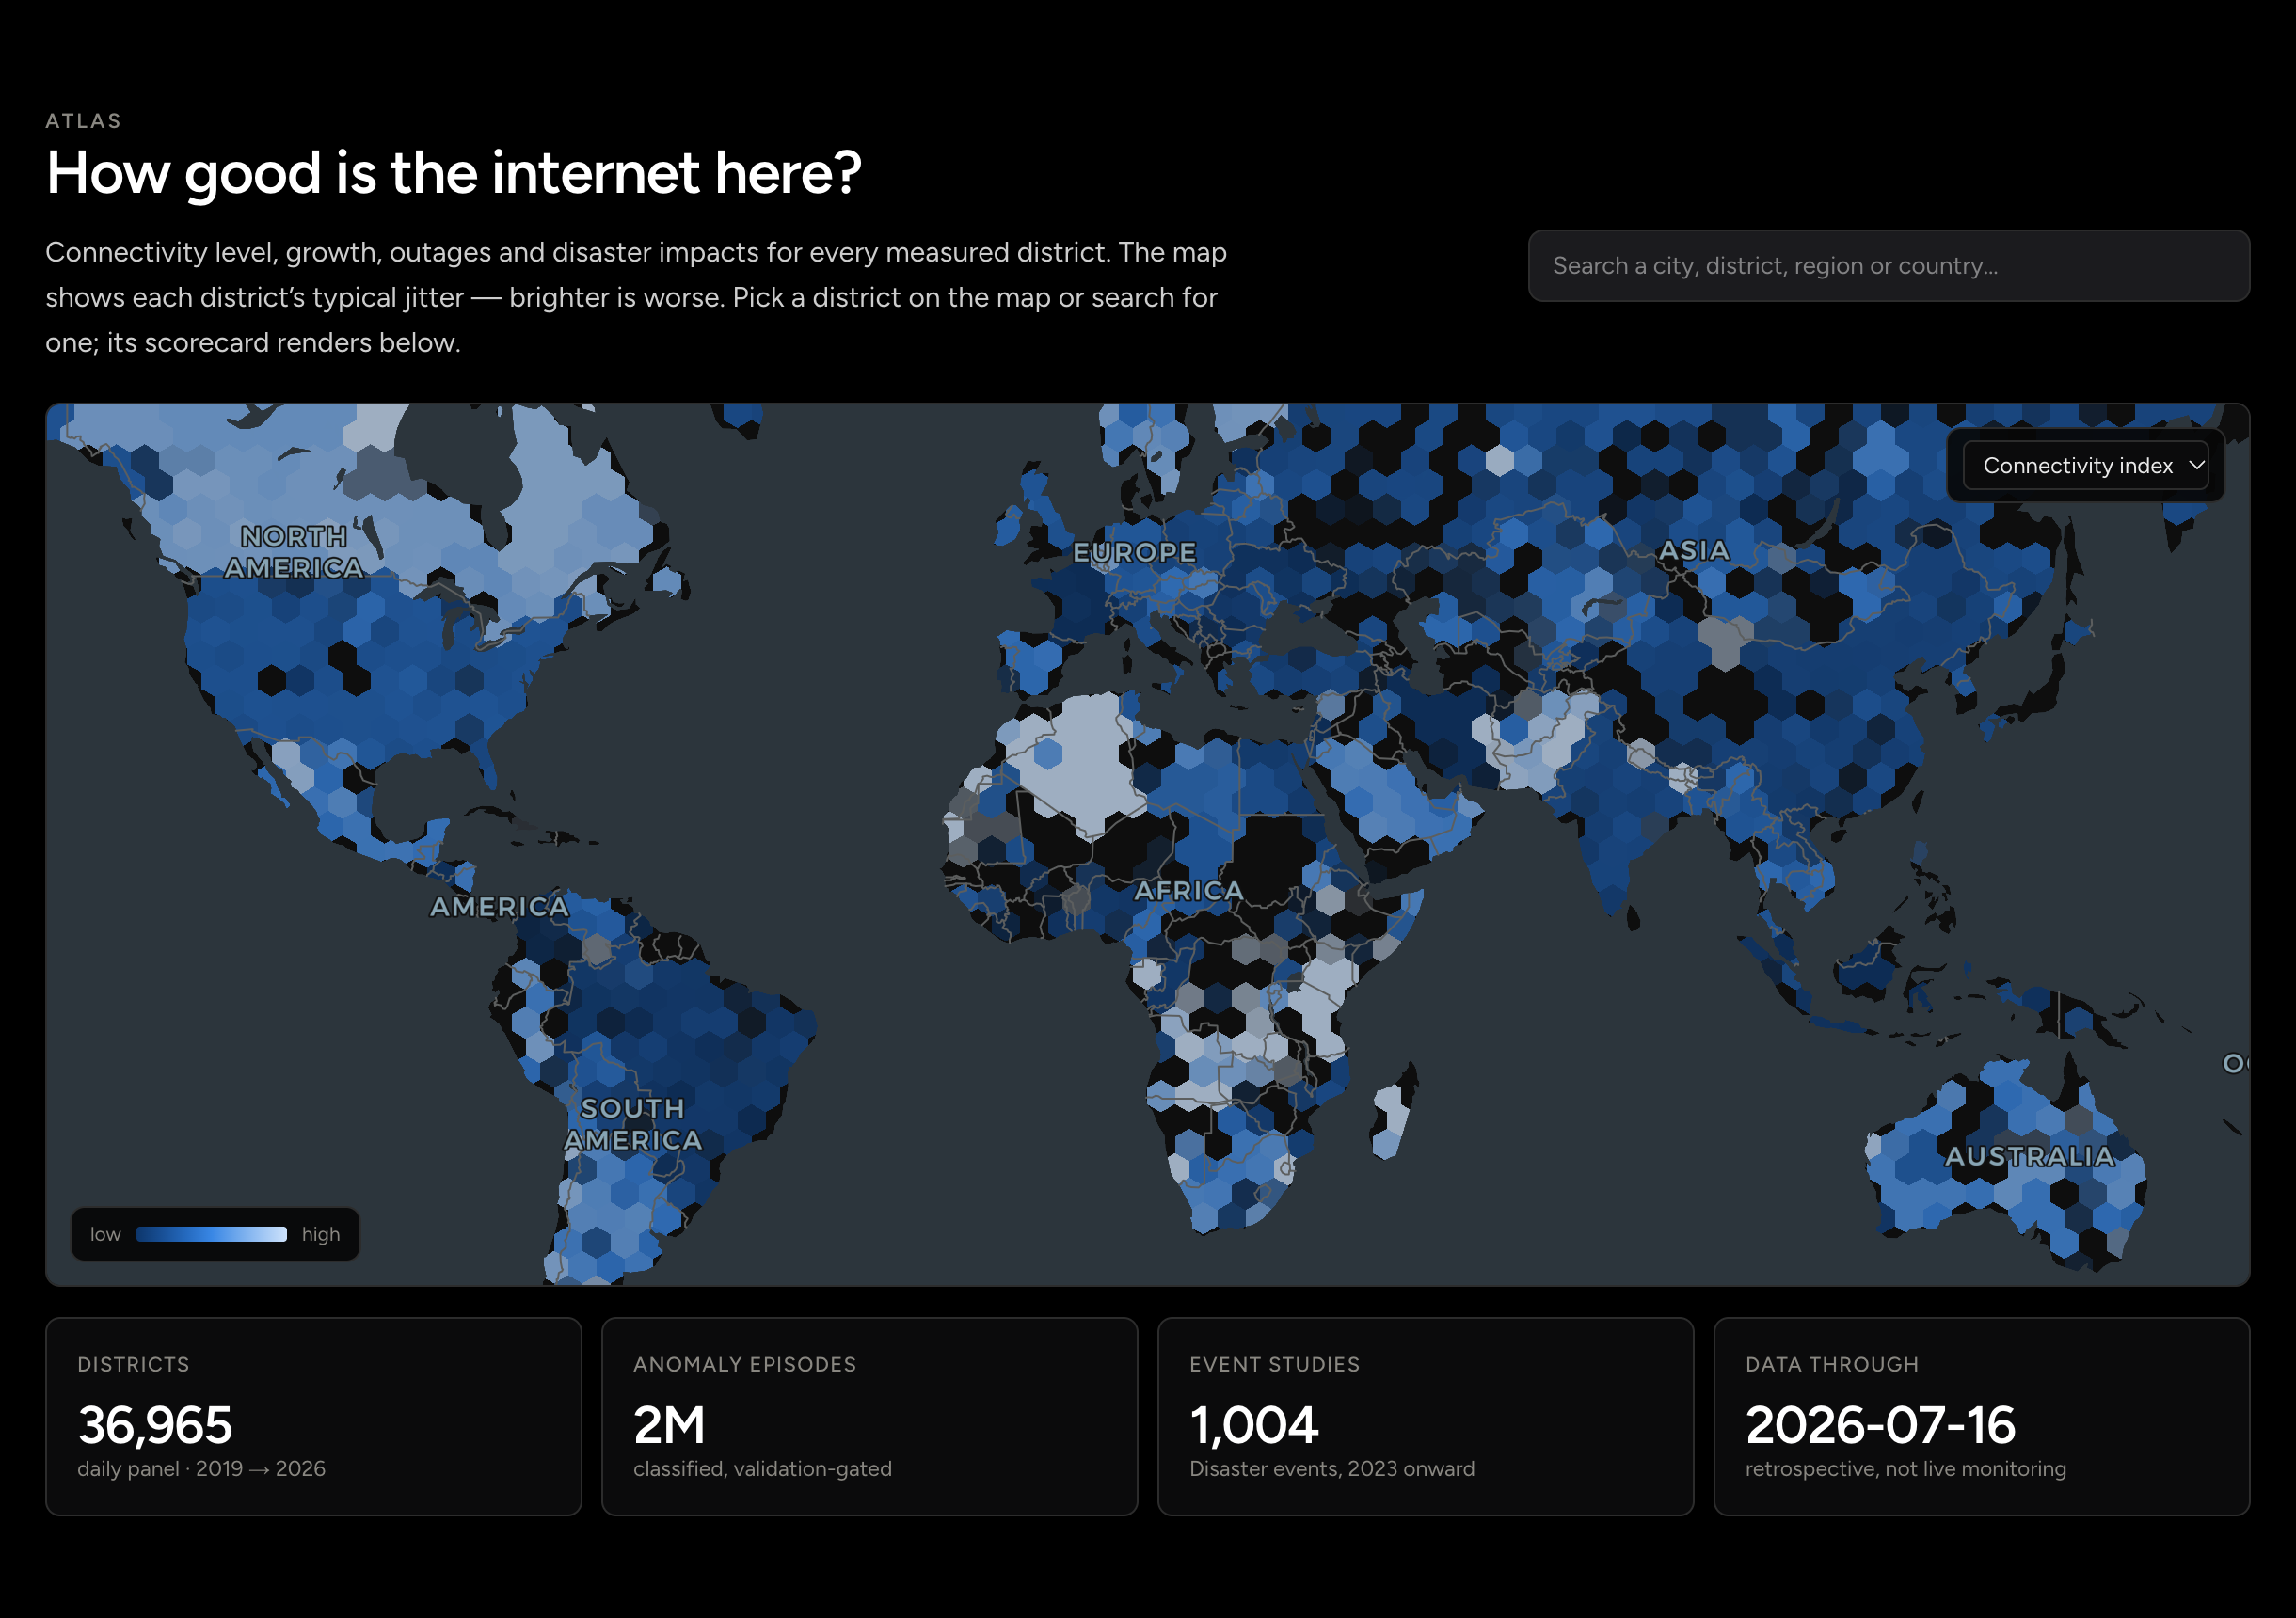
Regional Intelligence

Every district on one map, coloured by connectivity, latency or jitter, with the year-on-year change beside it. Open a district to read its typical day and week, and how thin or thick the measurement behind it is.

The Atlas: districts coloured by internet quality, with a district panel open

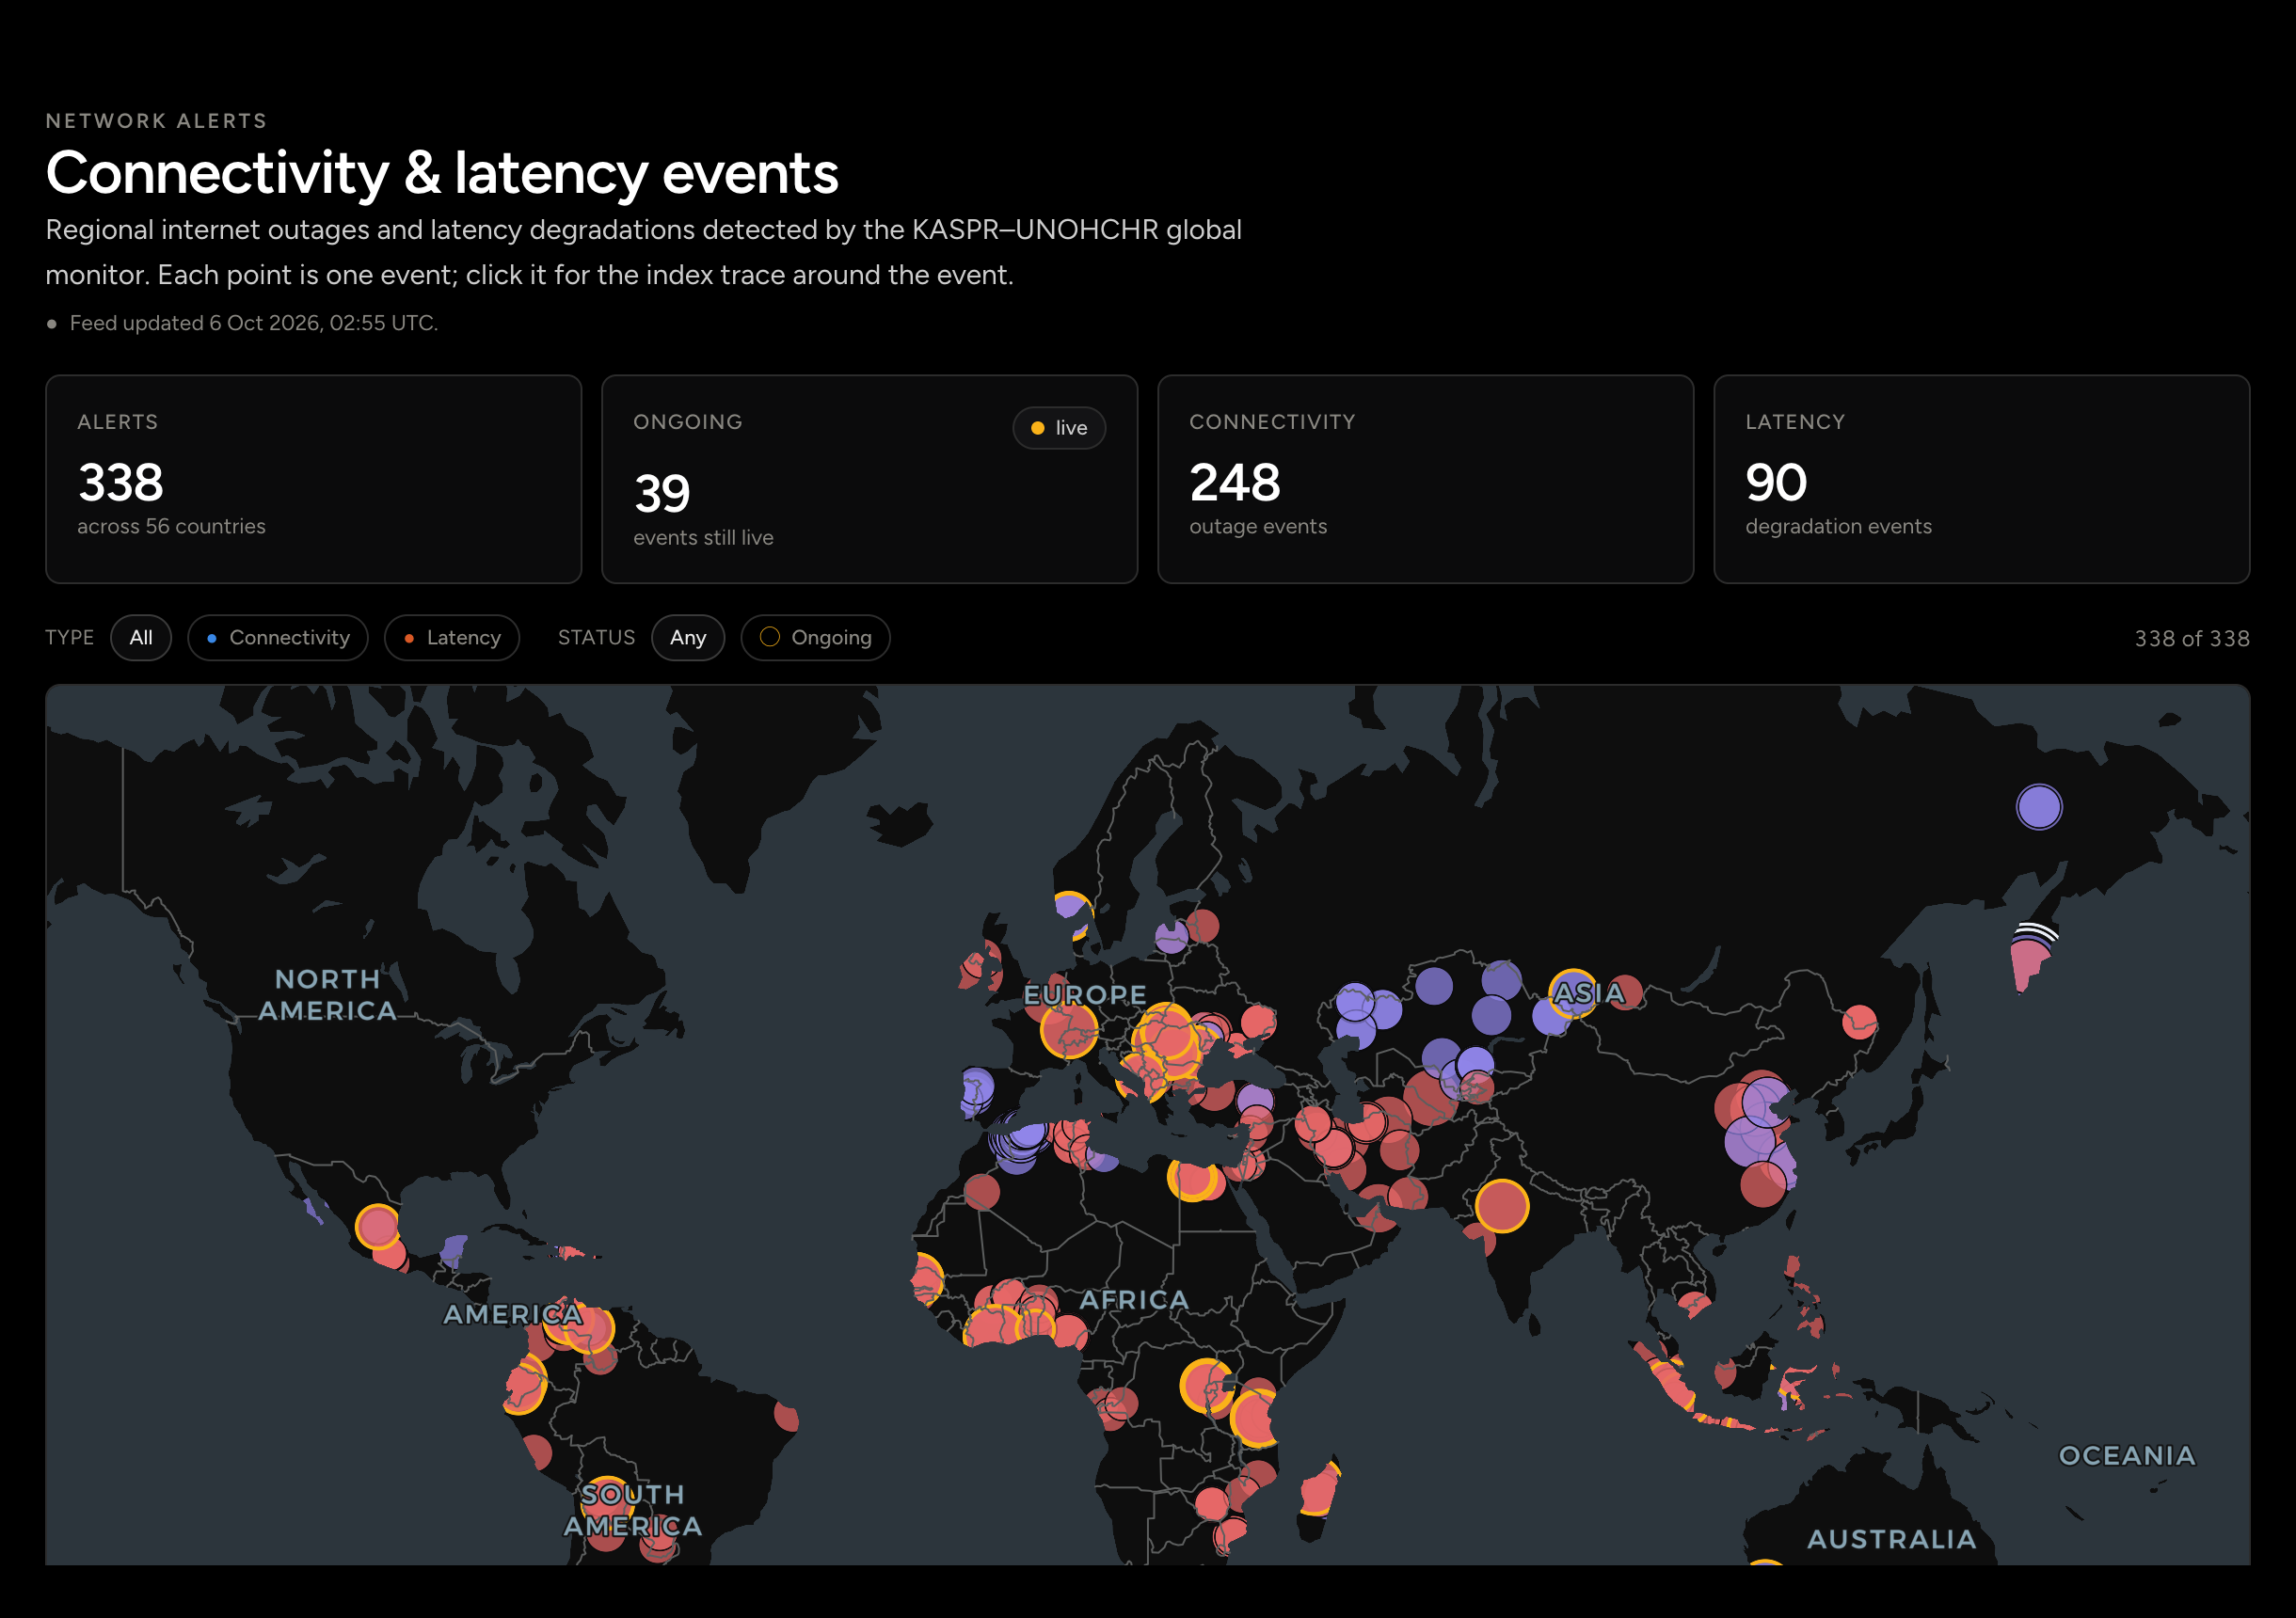
Situational Awareness

Alerts when a district’s hour falls outside its own 99.9% band, events matched to disasters and outages, and a replay of one district’s quarter hours. Thin cells stay blank rather than filled in.

The Alerts view: open alerts as cards, each naming the district and the hour

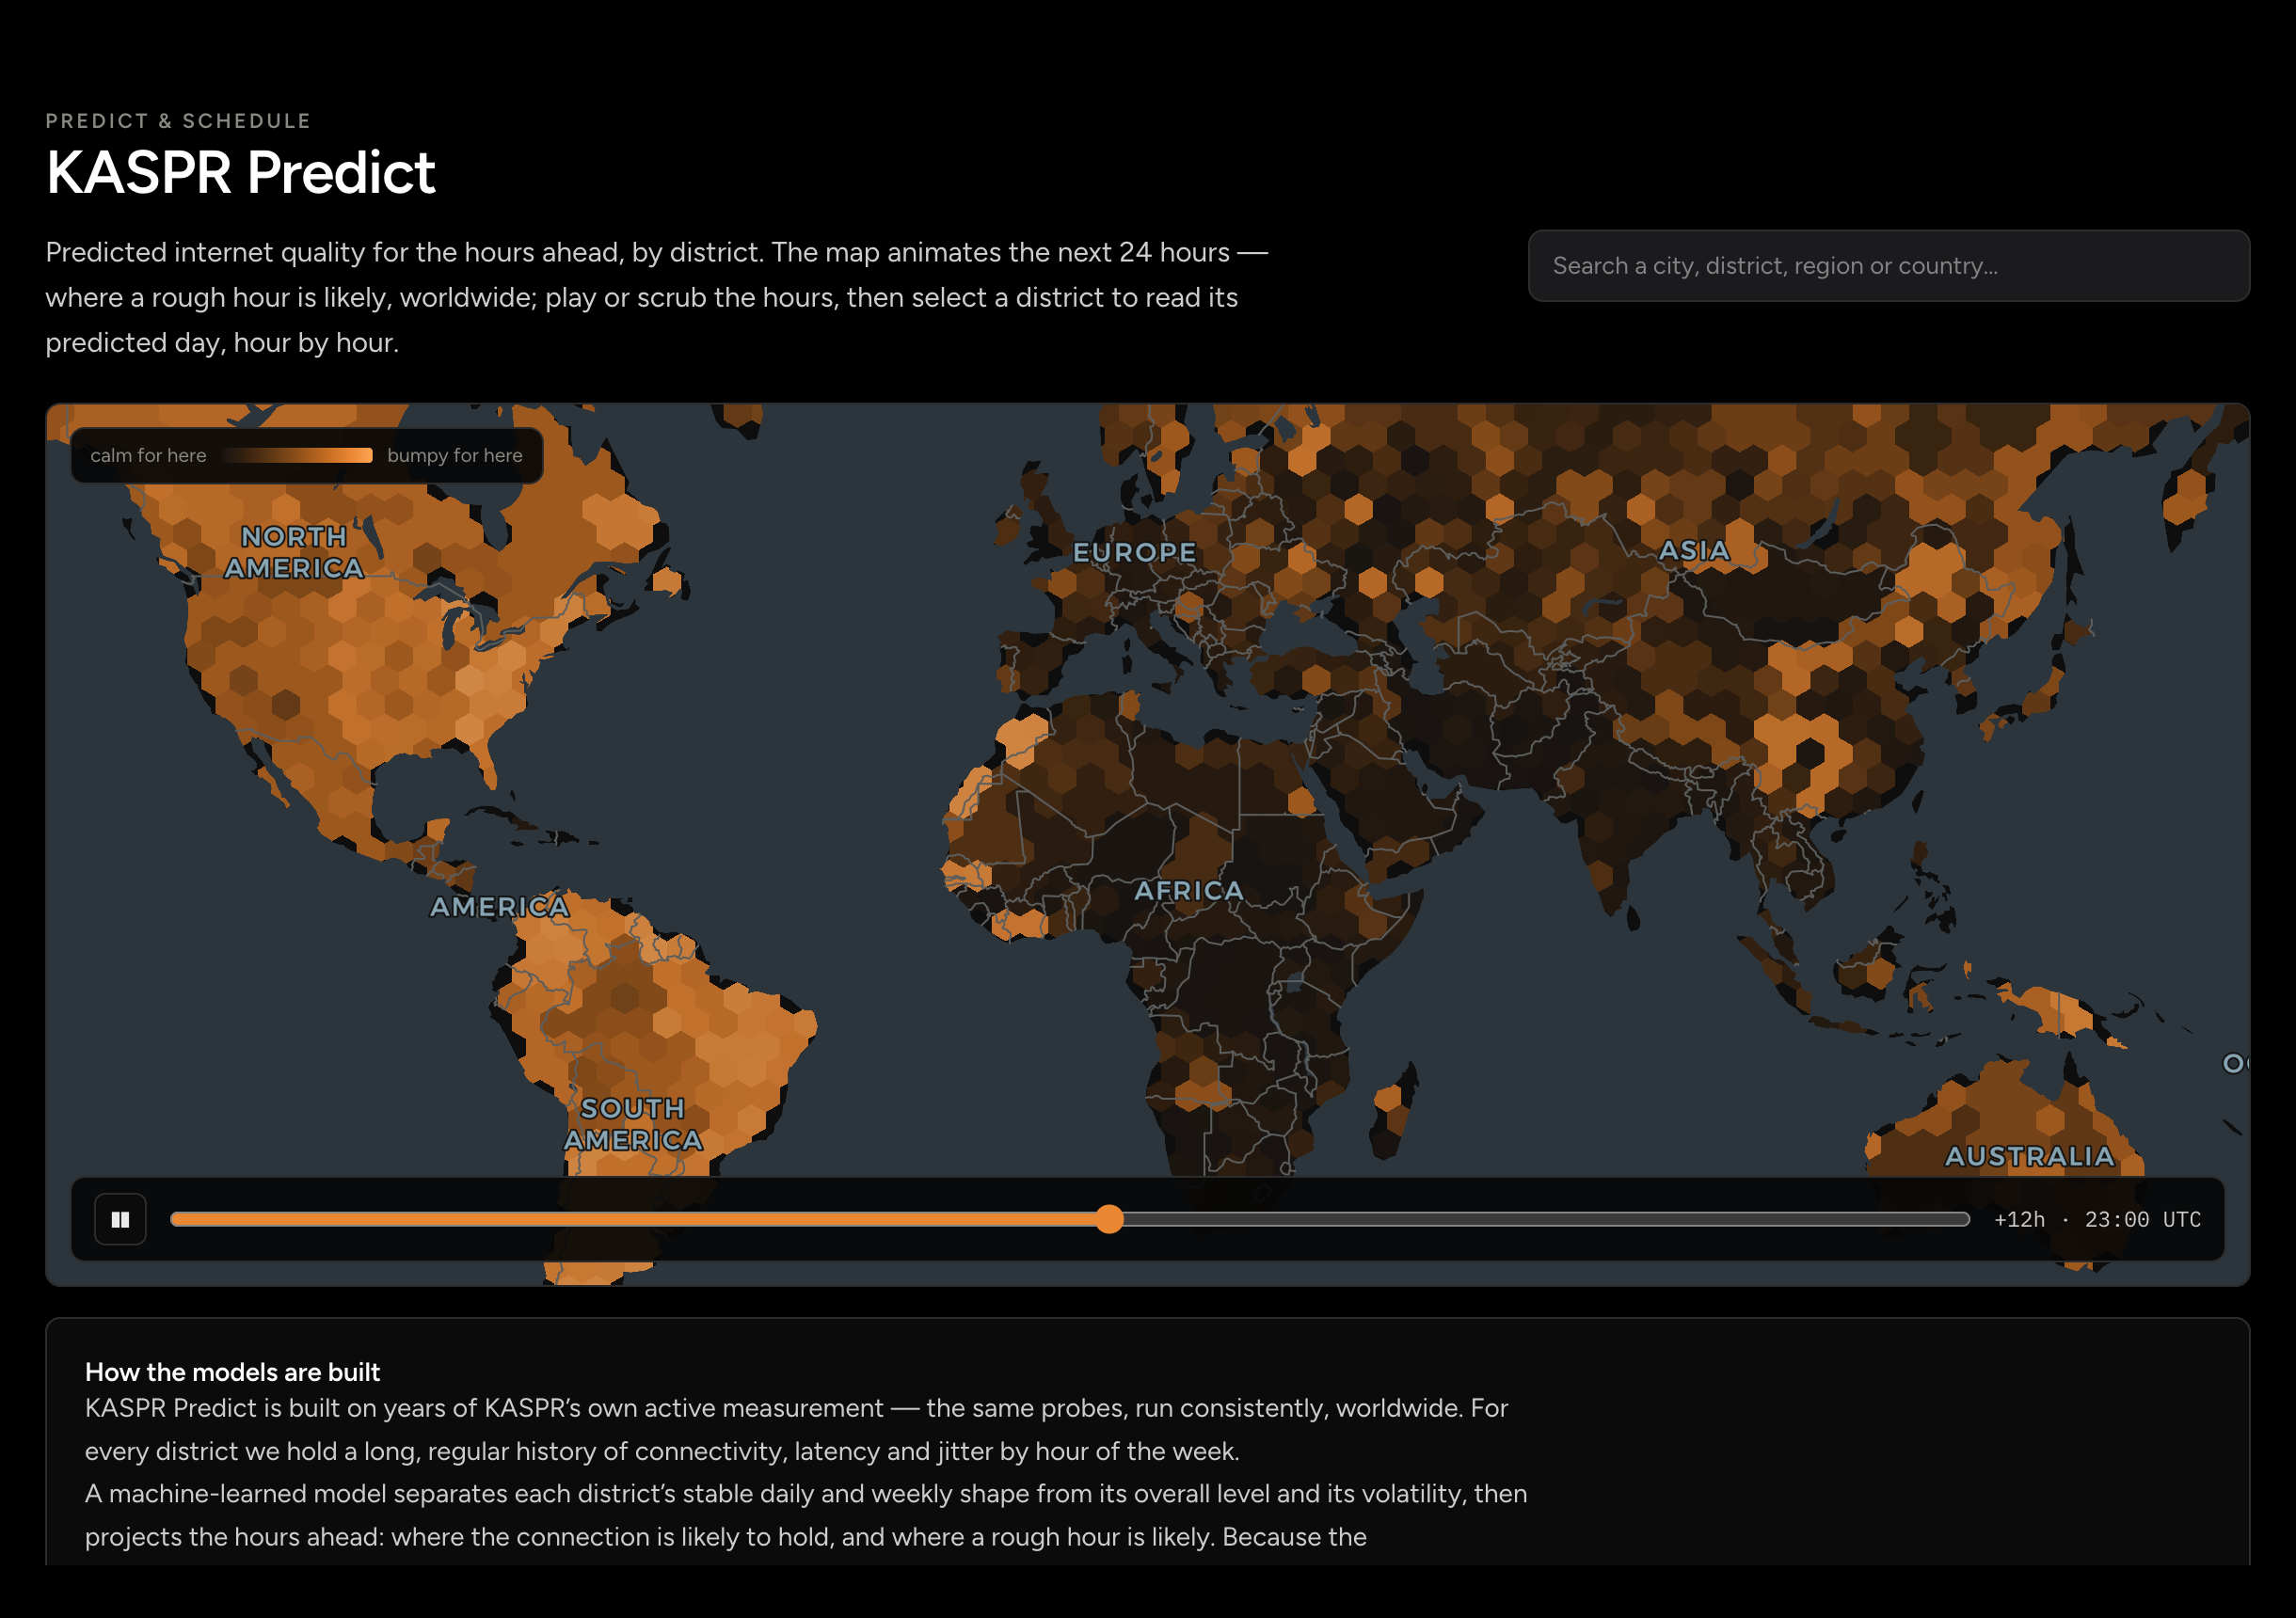
Predict & Schedule

The same model that explains last week is pointed at the next one: predicted quality per hour by district, meeting windows ranked across participants, and launch windows ranked across an audience mix.

The Predict map: districts coloured by the predicted quality of the hours ahead

Company / Asset

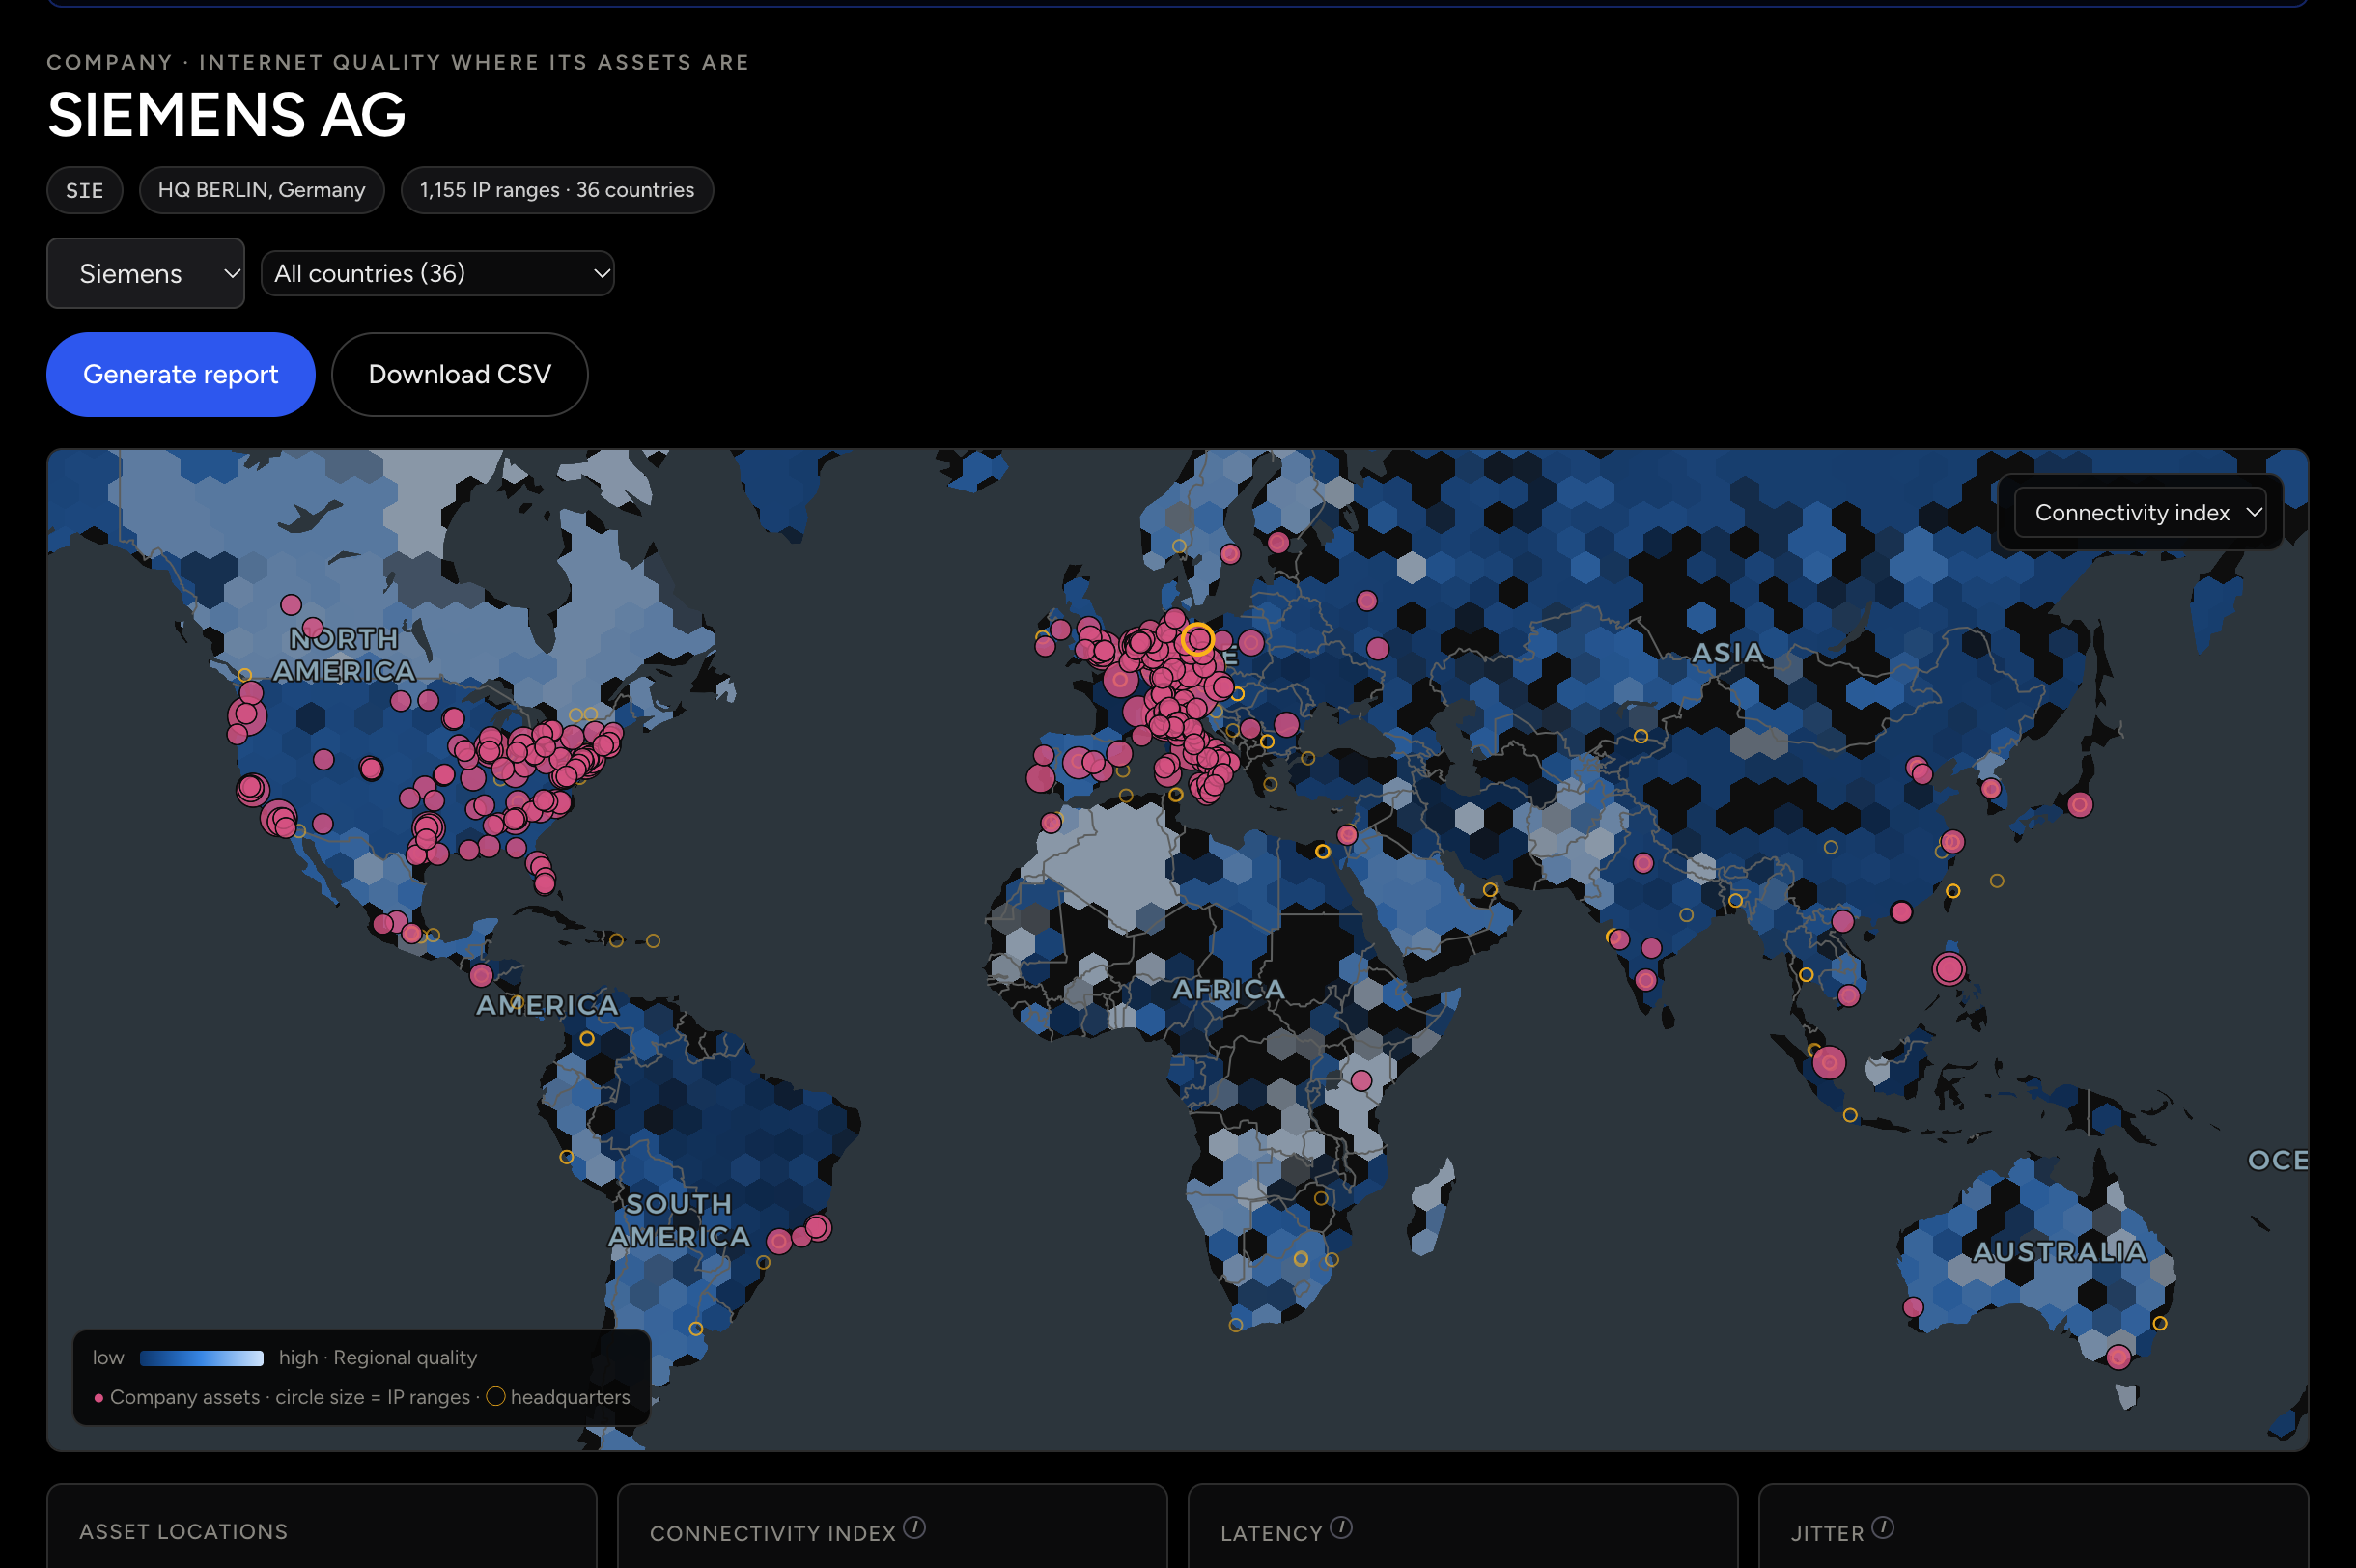
Listed firms’ infrastructure footprints, located district by district and matched to tickers: which issuers sat inside an event window, which assets depend on fragile districts, what a portfolio’s connectivity exposure looks like.

The Company view: a listed company’s footprint on the map with its districts ranked

What it’s built on

7+ years
of KASPR’s own hourly measurements
Global monitoring
We continuously measure over 400 million endpoints across 130+ countries.
6.7 trillion records
Machine learning models forecast typical hourly patterns from them.
Consistent
remote measurement technology and granular resolution.

KASPR Datahaus measurement has been covered by Reuters, The Economist and The Guardian, and is distributed via Snowflake, Carto and AWS. A Monash University spin-out. How to check our measurement →

Ask it from Claude Code

The same questions, asked the way you normally would

The dashboard’s data behind an MCP server. Each tab is one application, asked in Claude Code; the server answers from the measurement and the agent reads the result back.

claude — ~/work● kaspr-data · kaspr-timing
>

Simulated session: the typing is staged, but every tool call and result is what the Data MCP returned for these questions on the dashboard’s data, with the vintage named in each result. The Predict & Schedule tab is KASPR Schedule’s timing server.

How to install it →Terms →

Stories from the measurement

What the record shows when you look closely: an outage hour by hour, a listed company’s exposure, a district’s working day. Read them without an account.

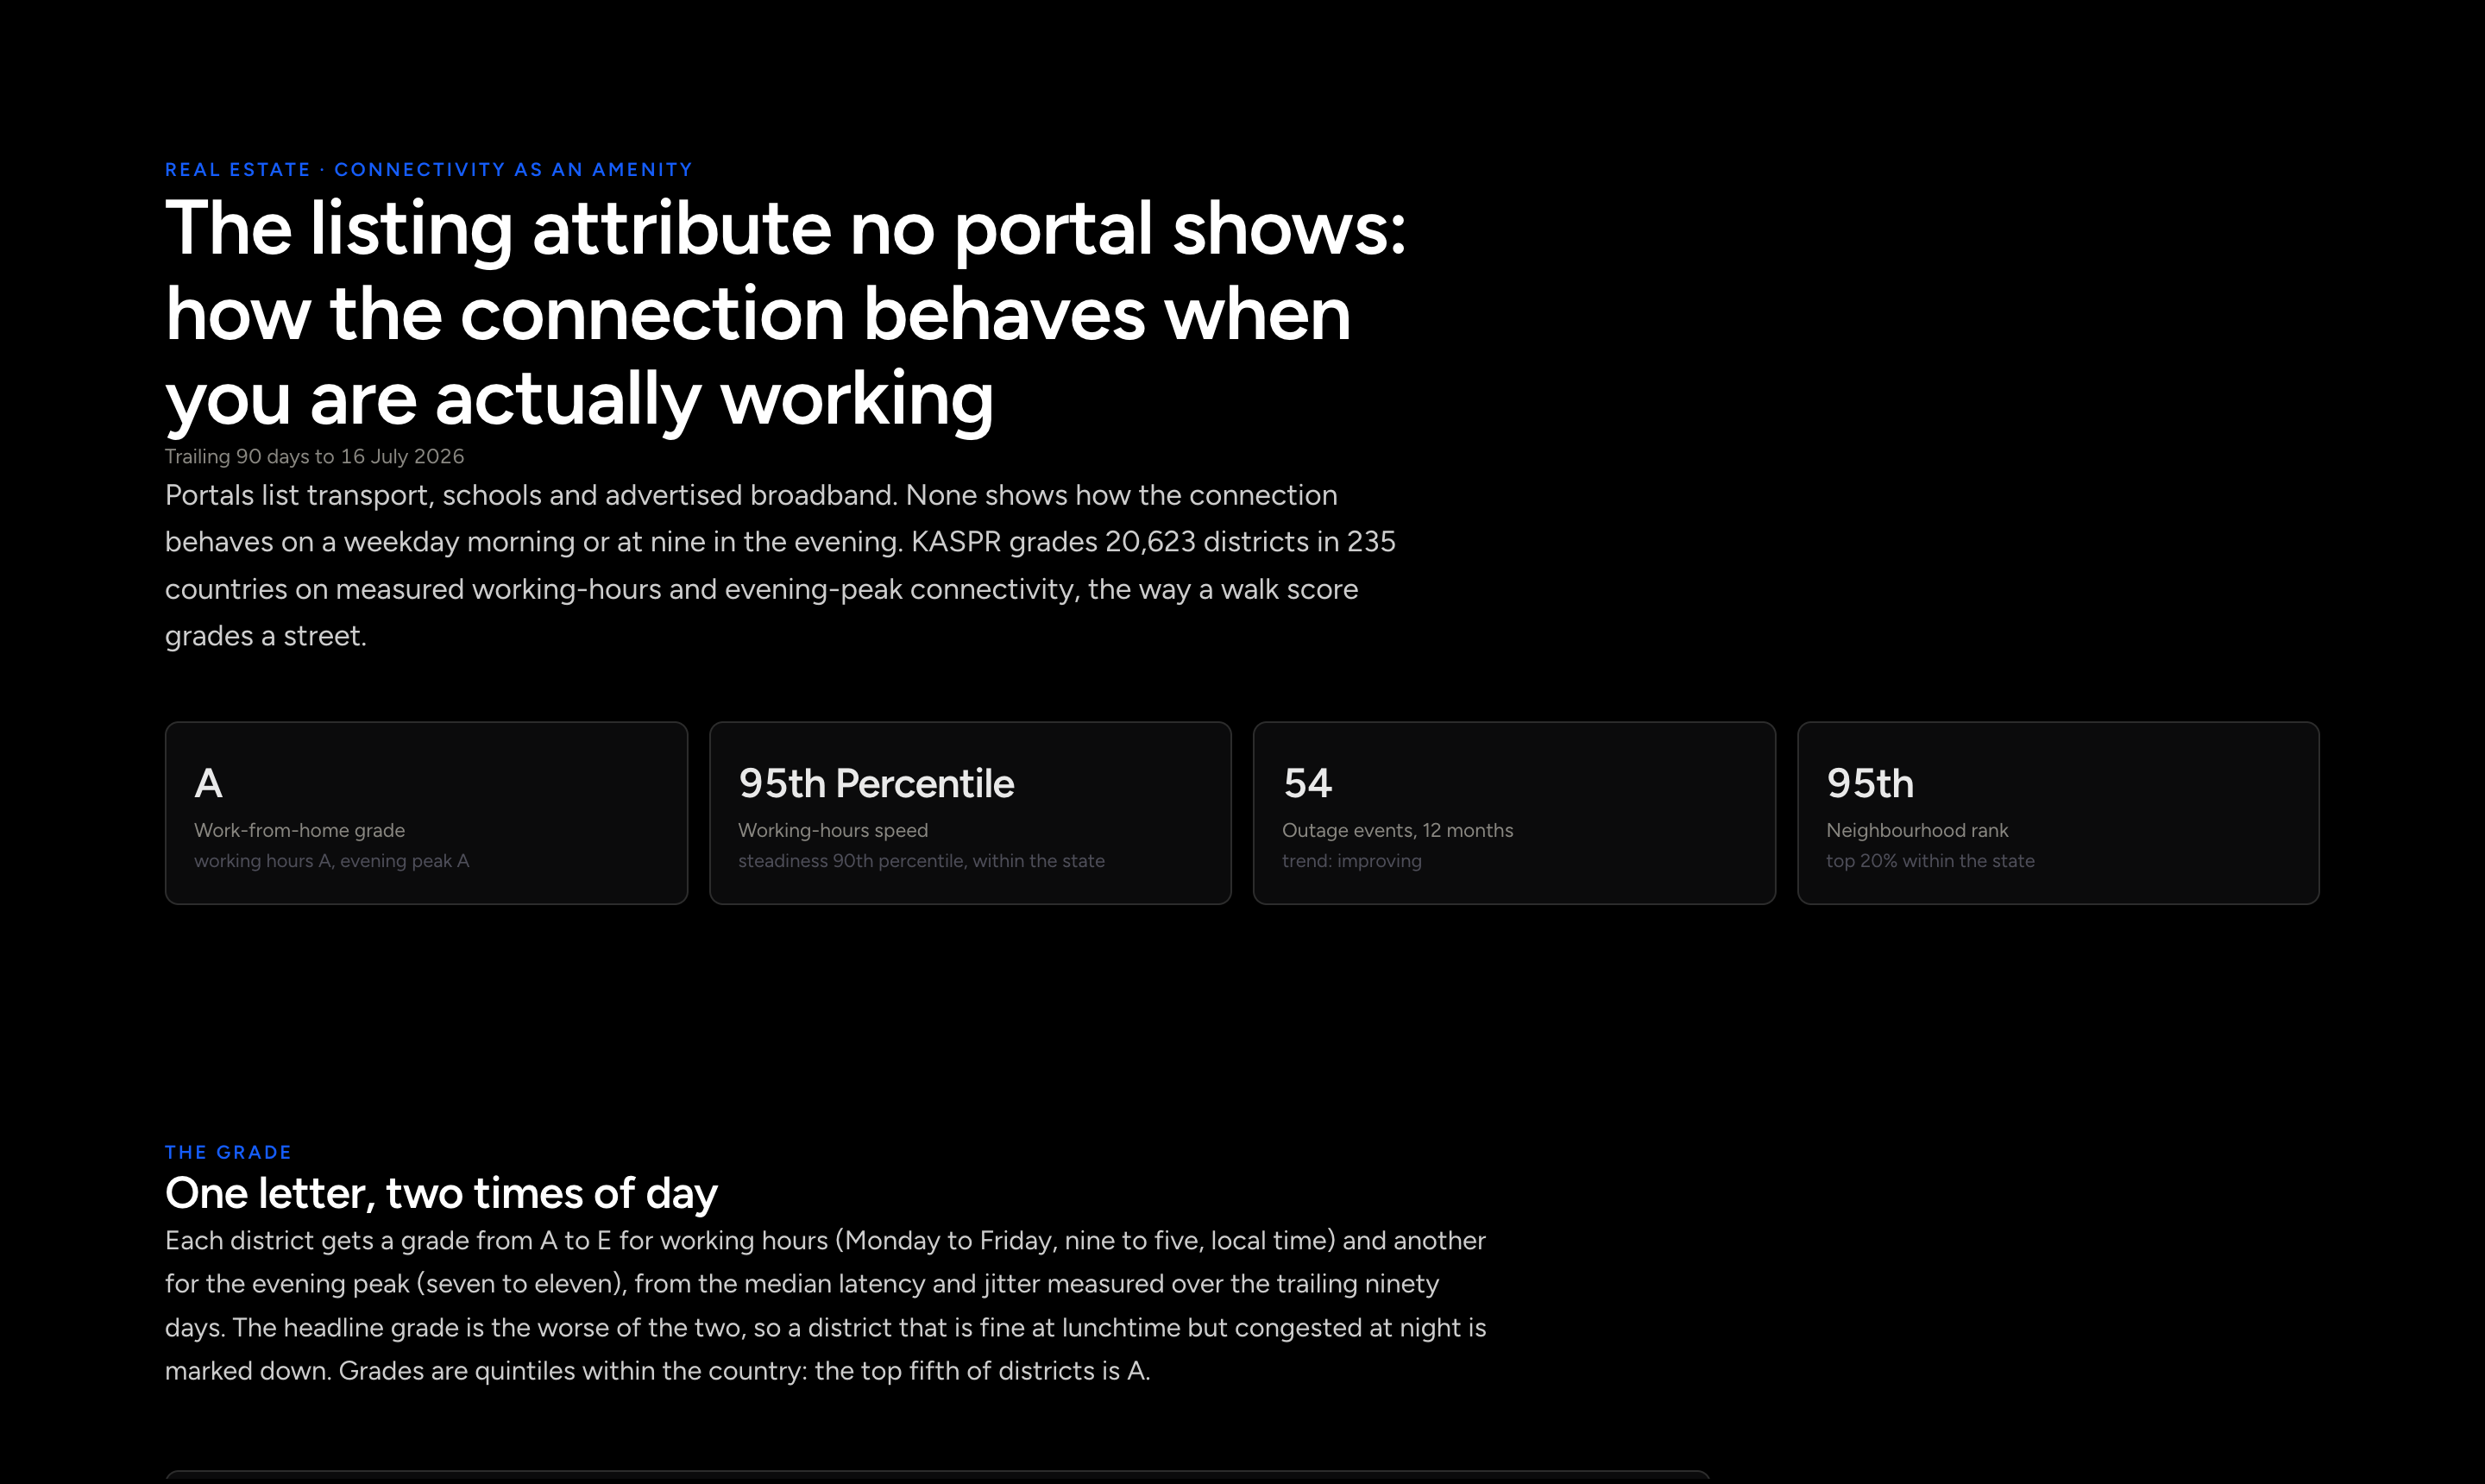
A work-from-home grade for every district, the way a walk score grades a street
Jul 2026

A work-from-home grade for every district, the way a walk score grades a street

20,623 districts graded on measured working-hours and evening connectivity; 7% of Australian districts earn an A.

Signal · Measured, not advertised, and split by time of day.

Action · Open the Atlas and compare two suburbs’ typical working day.
Which listed firms had infrastructure in the districts a blizzard broke
Jan 2026

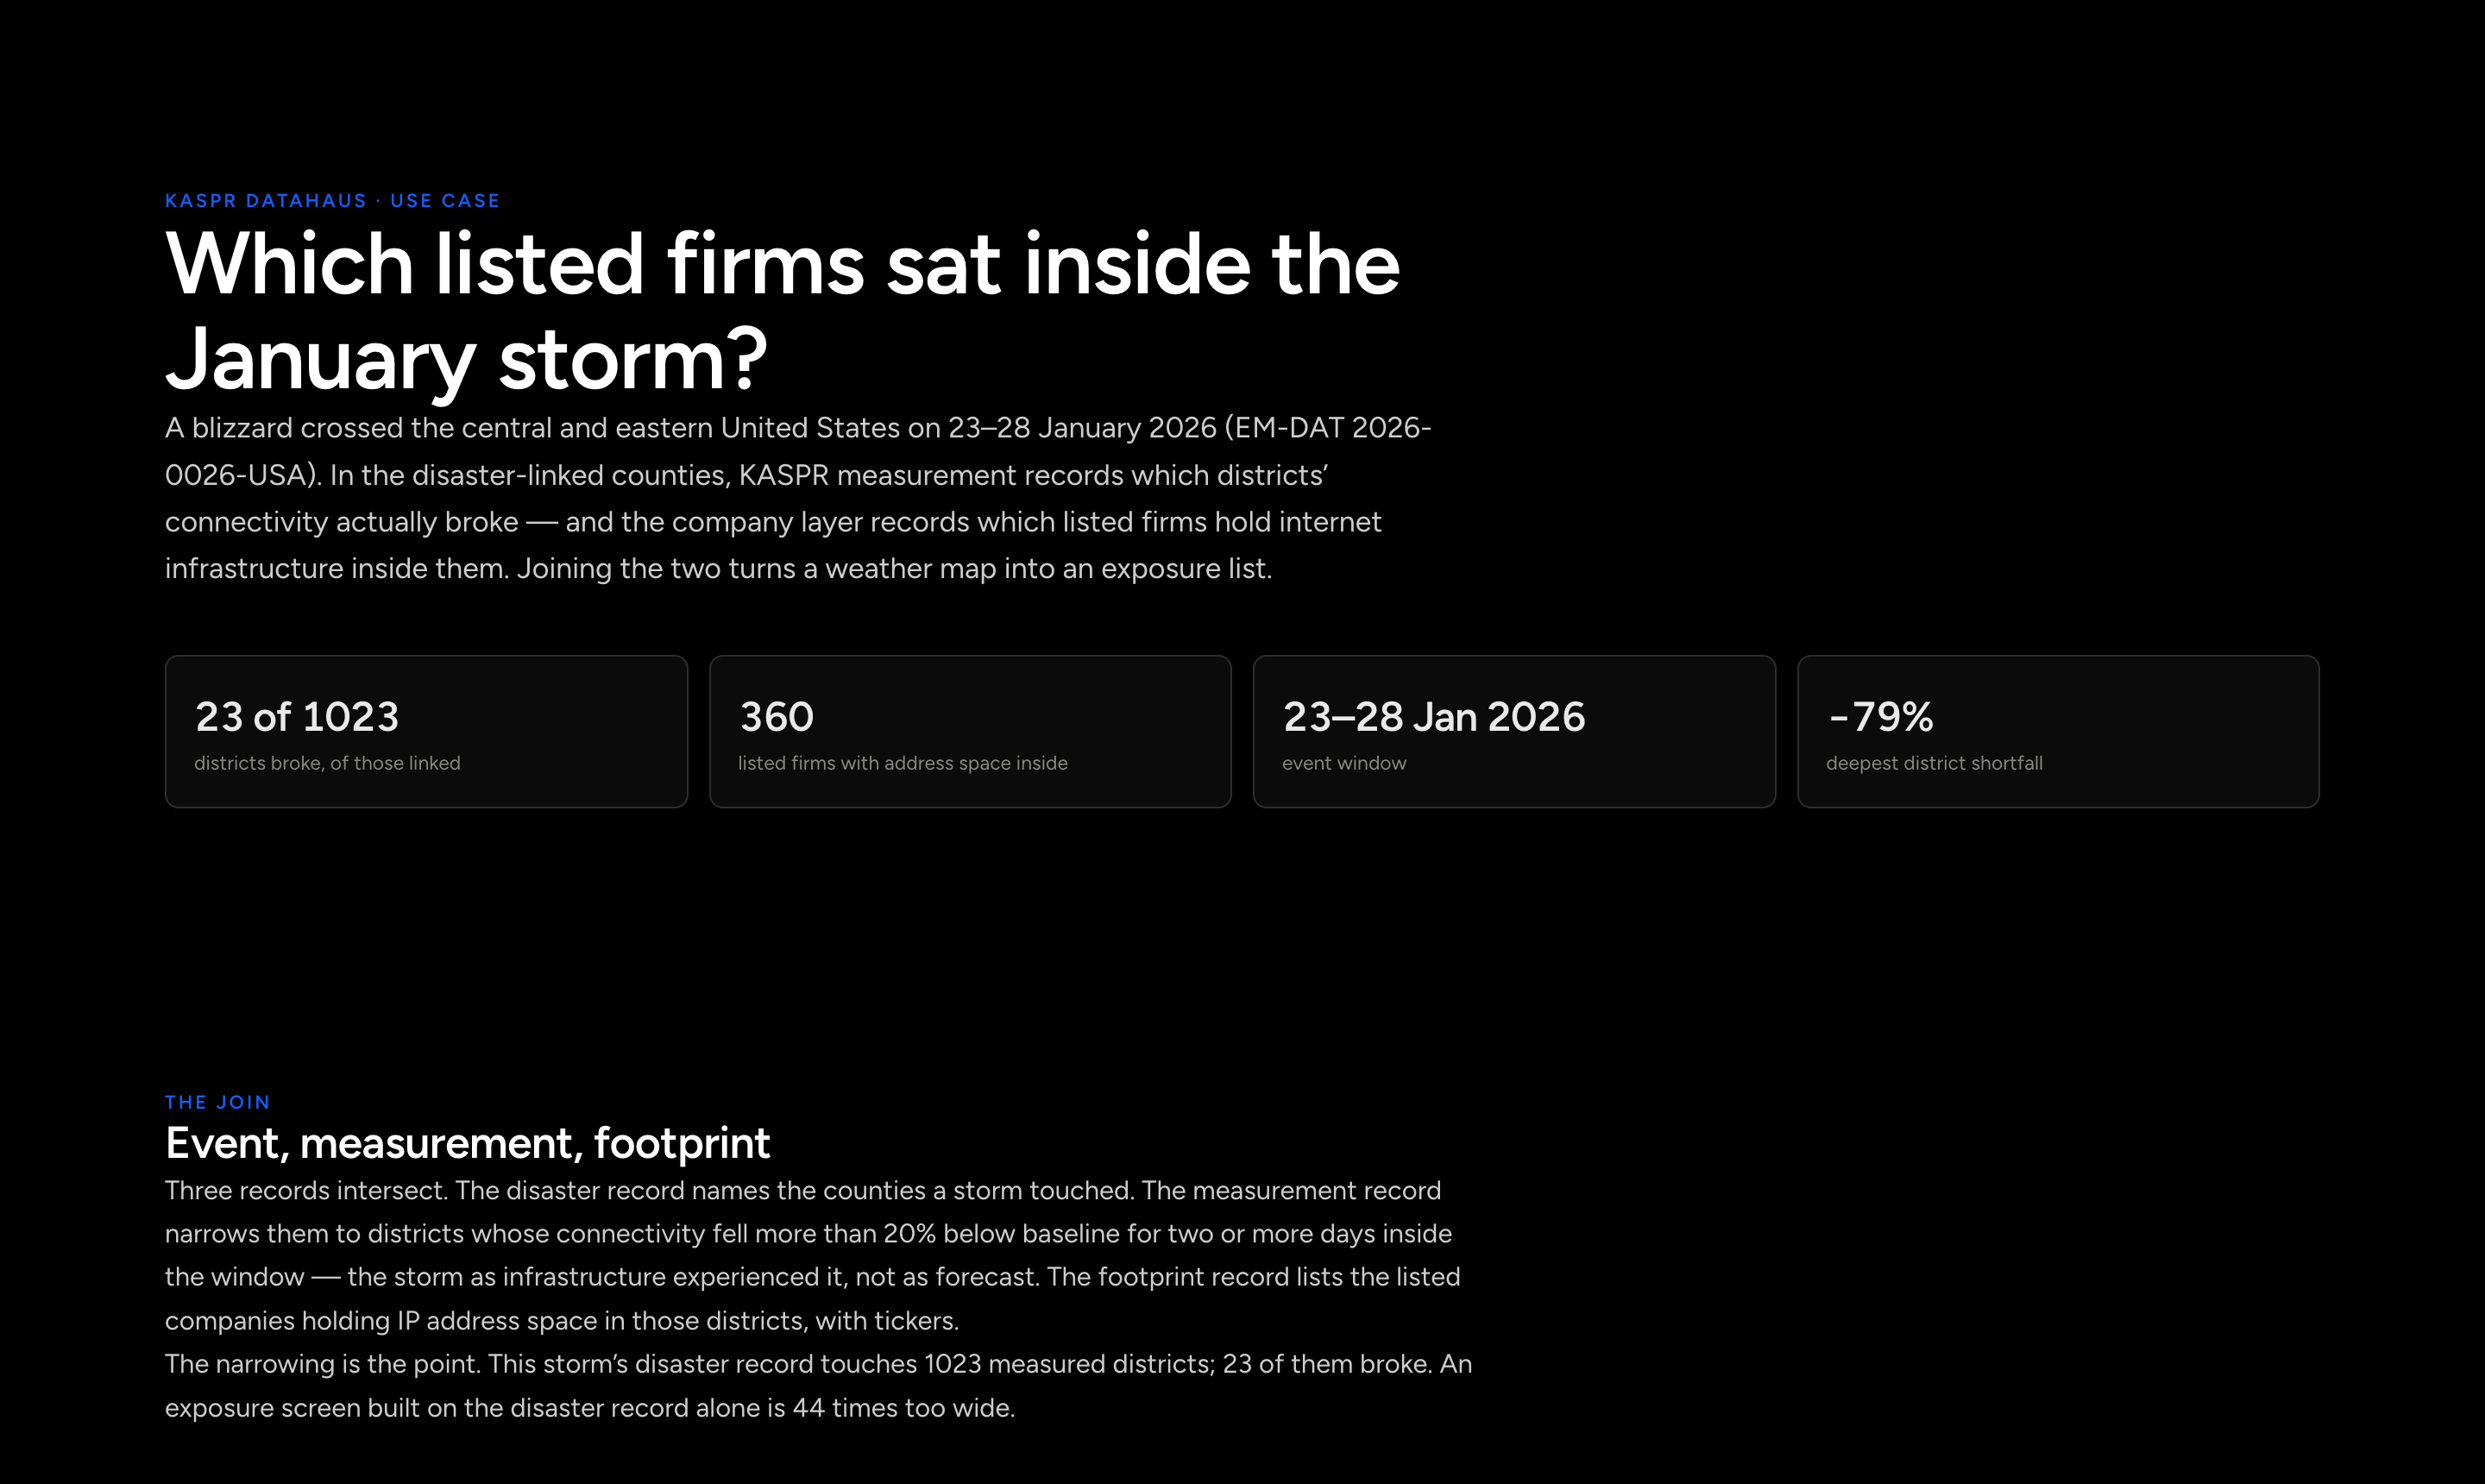
Which listed firms had infrastructure in the districts a blizzard broke

The disaster record said the January 2026 blizzard touched 1,023 measured US districts. Our measurement found only 23 of them actually lost connectivity. Inside those 23 sat infrastructure belonging to 360 listed companies, AT&T to Amazon, and the list existed days before any damage was reported.

Signal · an exposure list, days before damage reporting

Action · screen any event against your own footprint

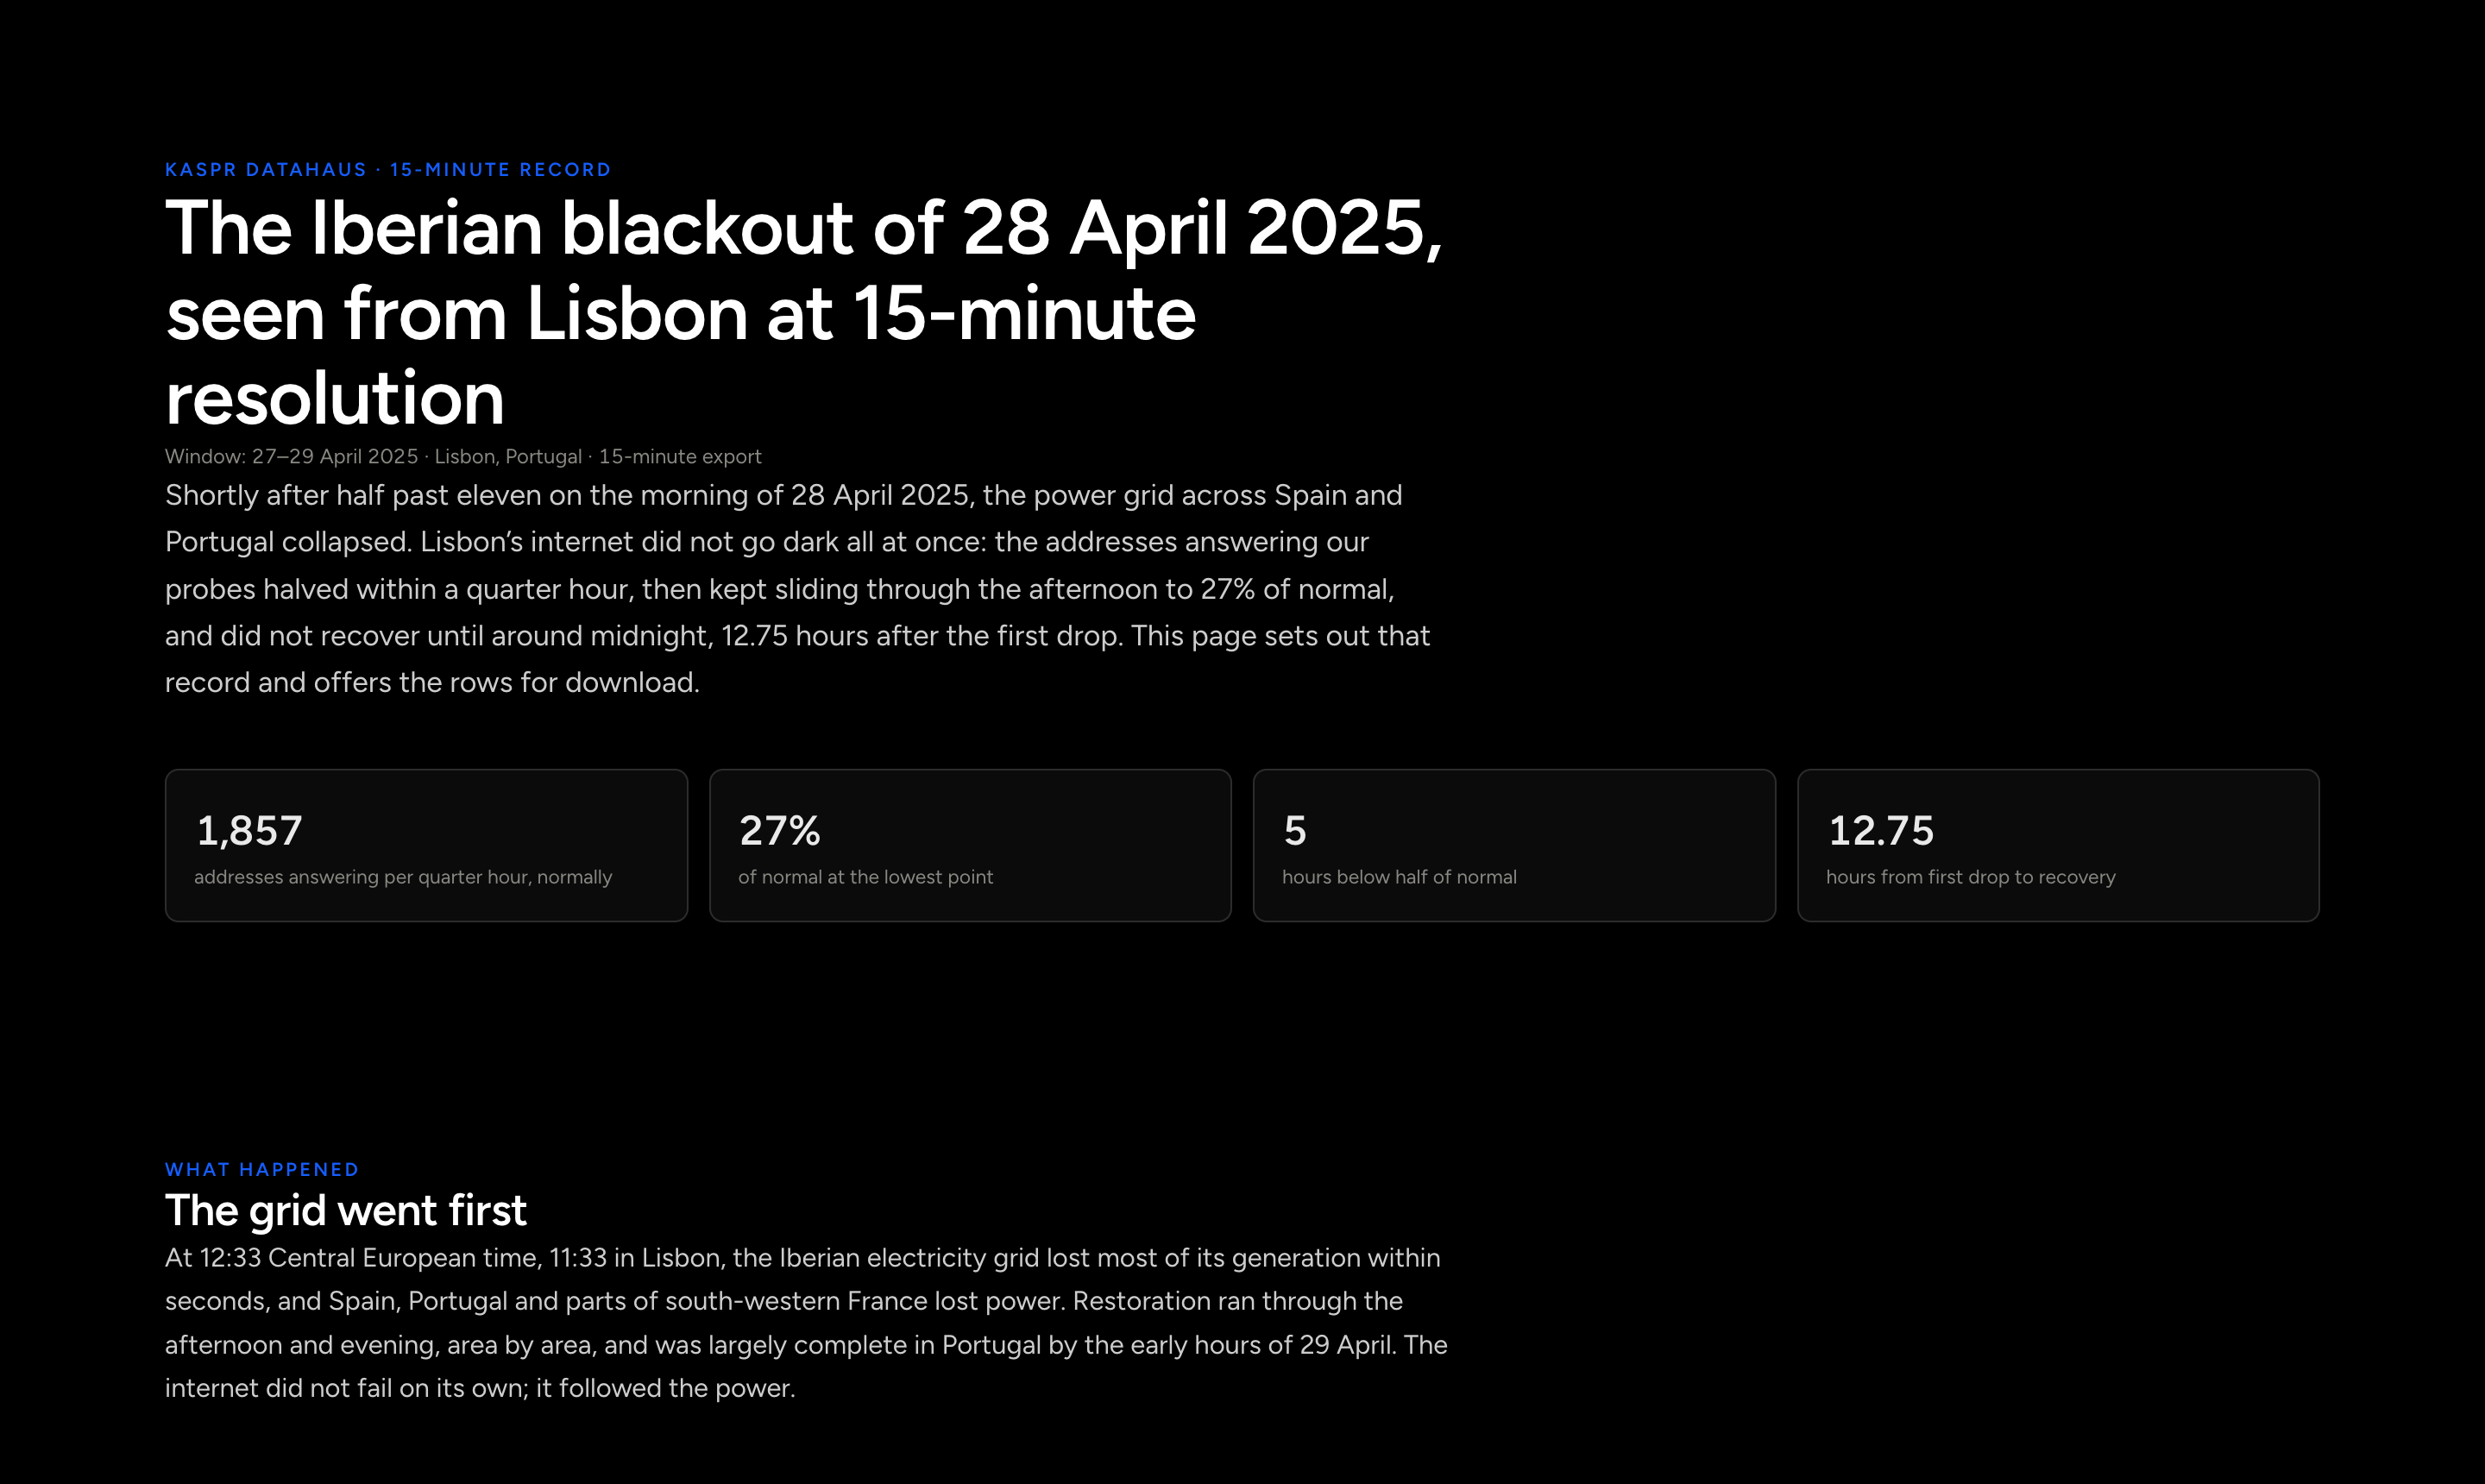
The Iberian blackout of 28 April 2025, as Lisbon’s internet saw it
Apr 2025

The Iberian blackout of 28 April 2025, as Lisbon’s internet saw it

When the grid collapsed, the addresses answering in Lisbon halved within a quarter hour, then kept sliding through the afternoon to about a quarter of normal by early evening. Recovery took until around midnight, some thirteen hours in all, with the rows to download.

Signal · power loss and internet loss on one clock

Action · watch any district at 15-minute resolution

All stories →

Get started

Sign in with Google and you are in at once, on the Free plan. Or enter your email and we send you a sign-in link; it signs you in and creates your account.

Continue with Google

An account on the spot, no request needed.

No password: the link signs you in.

By continuing, you agree to our Terms & Conditions and Privacy Policy.

Already invited? Log in