
KASPR Company Intelligence
The internet record behind any listed company
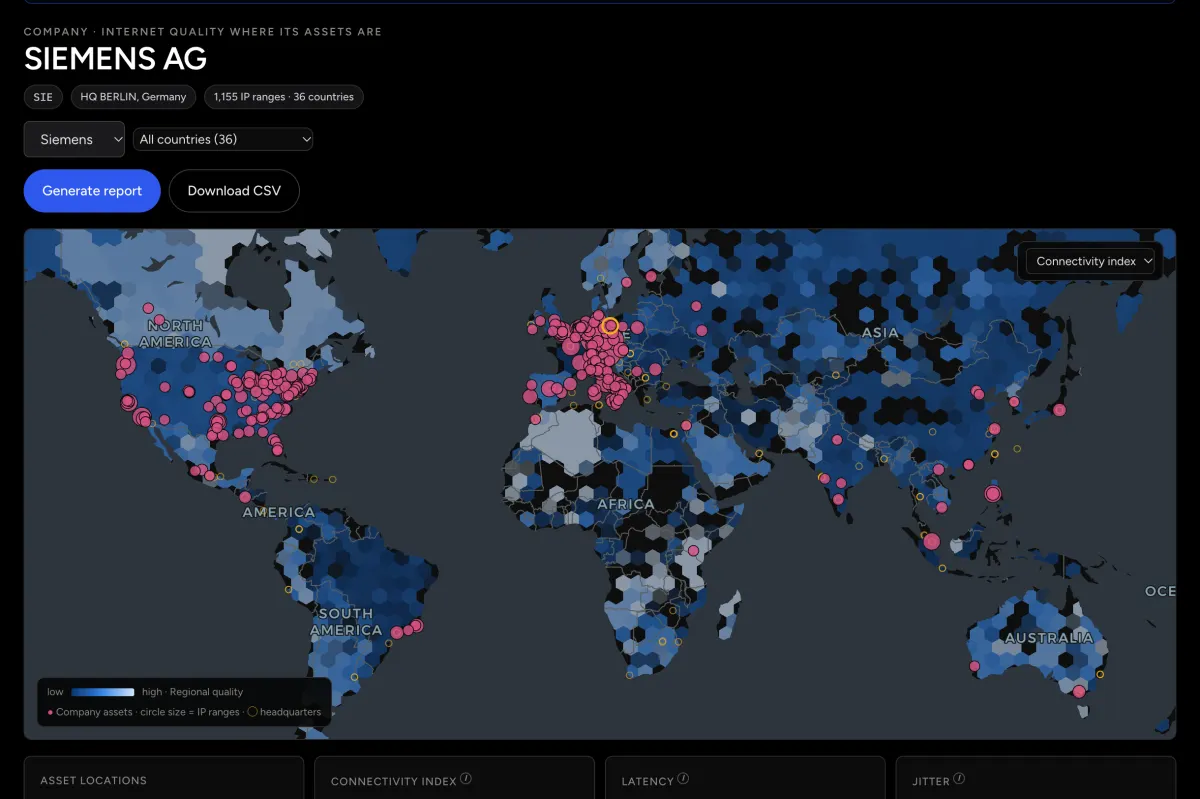
Search for a company by name, ticker or ISIN and read what KASPR has measured in the districts where its internet infrastructure sits: how quick and steady those connections typically are, how they have moved over two years, and how often they have broken since February 2019.
Names you type are looked up on our server; nothing else leaves your browser.
Digital Infrastructure Intelligence Report · Company profile
Internet conditions across SIEMENS AG’s footprint
The measured internet around every district in which SIEMENS AG holds internet address space, read the same way for every listed company.
Two years of months
Range-weighted monthly latency and jitter across the footprint, against the median measured district worldwide (dashed).
Conditions in major locations
The four districts carrying the most of the company’s address space, with the latest month’s conditions and the Report Card bucket.
| District | Ranges | Latency idx | Jitter | Conn. index | Bucket |
|---|---|---|---|---|---|
| OberbayernBayern · Germany | 137 | 88 | 57 ms | 103.9 | Sound |
| MilanoLombardia · Italy | 70 | 89 | 67 ms | 83.3 | Sound |
| DarmstadtHessen · Germany | 54 | 89 | 55 ms | 99.5 | Sound |
| RomaLazio · Italy | 32 | 89 | 78 ms | 86.6 | not in the Report Card |
Digital Infrastructure Risk · Footprint hazard profile
Network disruption risk across SIEMENS AG’s footprint
How often, how deeply and for how long connectivity has broken in the 280 districts that hold the company’s address space since February 2019, and how that compares with every other listed company’s footprint and with the median measured district. This is the hazard record for the places the company depends on. It says nothing about the company’s own networks, contracts or backups.
The districts holding SIEMENS AG’s address space have recorded 2.9 disruption days per site a year: 6,021 days in 647 episodes across 221 of 280 districts in 7.4 years. The median listed company sees 3.4 and the median Industrials company 3.3; 55% of listed footprints see more than this one.
20 weeks since 2019 saw 1,811 or more districts worldwide fall at once. Falls that wide point at the measurement rather than at the places, so those weeks are set aside where the report lists recent episodes and gives the cleaner twelve-month figure.
Recent episodes
The three most recent disruption episodes in footprint districts outside measurement-wide weeks. Depth is the fall in responding addresses below the district’s own baseline. The record says when and how deep, not why.
| Start | End | District | Days | Class | Depth |
|---|---|---|---|---|---|
| 9 Mar 2026 | 10 Mar 2026 | ArapahoeUnited States · 2 ranges | 2 | collapse | 93% |
| 9 Mar 2026 | 18 Mar 2026 | TianjinChina · 1 range | 10 | sustained | 33% |
| 5 Mar 2026 | 8 Mar 2026 | DelhiIndia · 1 range | 4 | outage | 45% |
647 episodes in all since February 2019; the full register is in the full report.
Disaster-linked events in the footprint
The three most recent recorded disasters since July 2024 whose affected districts hold the company’s address space. The match says the event and the address space share a district, not that the address space was hit.
| Start | Event | Districts | Ranges | Places |
|---|---|---|---|---|
| 21 Apr 2026 | WildfireWildfire (General) · United States of America | 10 | 19 | Brevard, Orange, Palm Beach, Miami-Dade, Fulton, Leon, Gwinnett, Broward, Cobb, Forsyth |
| 21 Apr 2026 | StormSevere weather · Kenya | 1 | 1 | Nairobi |
| 20 Apr 2026 | FloodFlood (General) · Brazil | 1 | 5 | São Paulo |
72 events in all; the full list is in the full report.
Full report
Want the full report?
The full report carries the whole record for the footprint: every district with its own conditions and hazard profile, the risk indicator panel against the listed-company and world medians, the connectivity Report Card against sector peers, seven years of disruption days, the full episode register and event list, and the owner strings behind the match.
- Every footprint district with its own conditions and hazard profile
- Risk indicator panel: frequency, severity, duration, recovery, instability, co-disruption, concentration
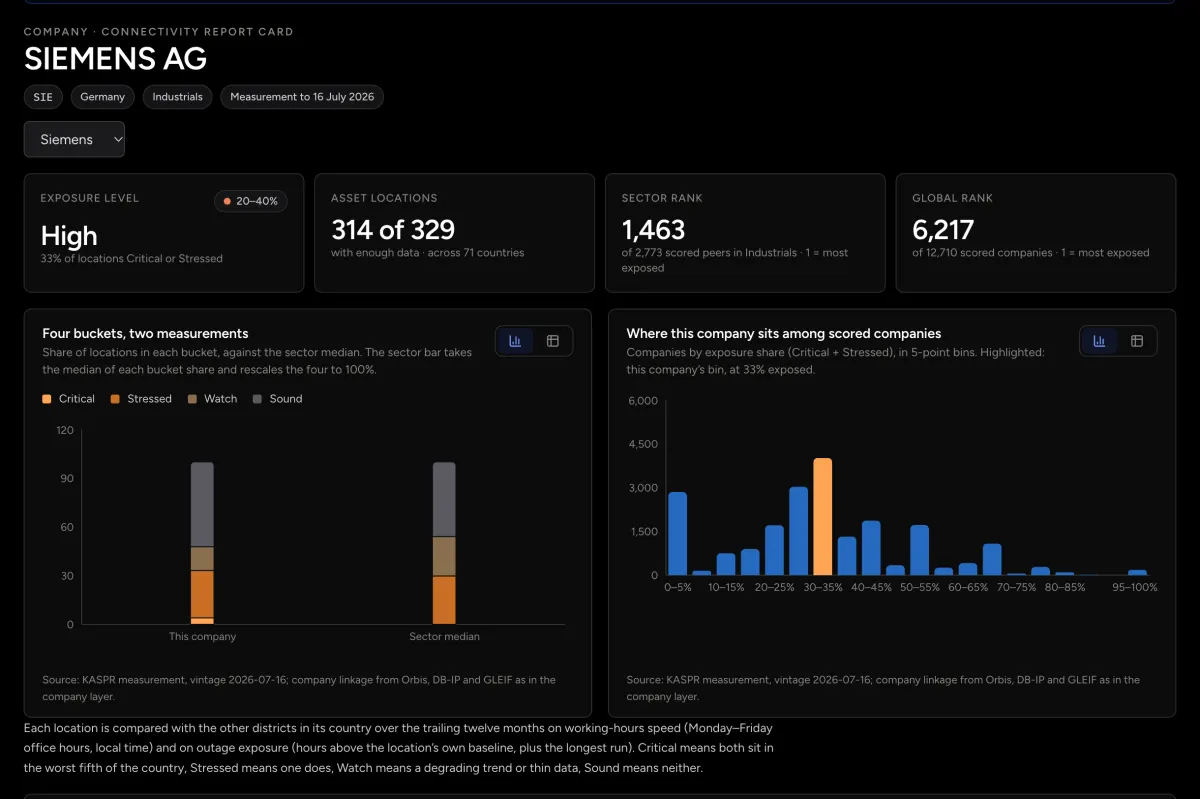
- Connectivity Report Card against sector medians and named peers
- Full episode register and disaster-linked event list since 2019
- Provenance: the owner strings and group structure behind the footprint
Get the full report
Full report
US$999
The full report for this company, with PDF, CSV and XLSX exports. Pay once; 30 days to download.
Annual subscription
US$10,000 a year
The full report for this company, kept current: each monthly release updates it and the link is sent by email. Renews automatically after a year; cancel any time.
More data? Dashboard solutions
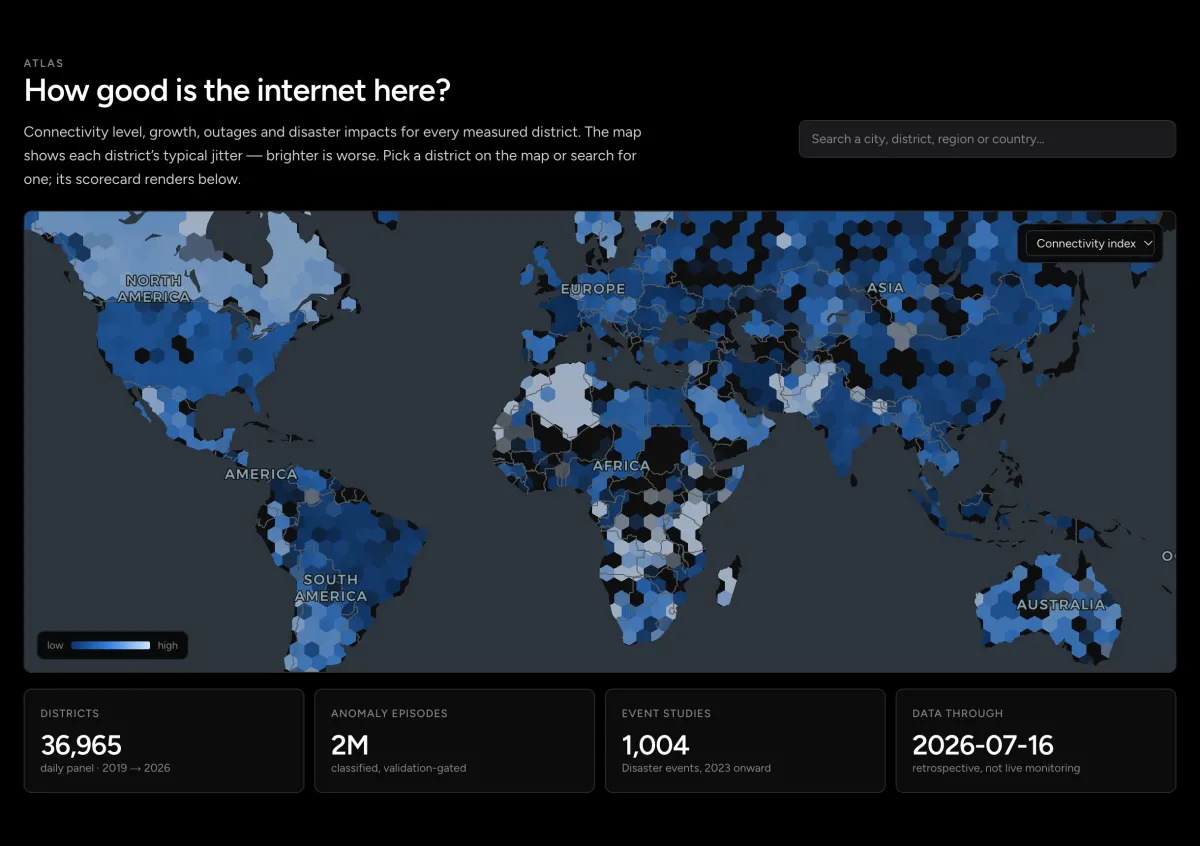
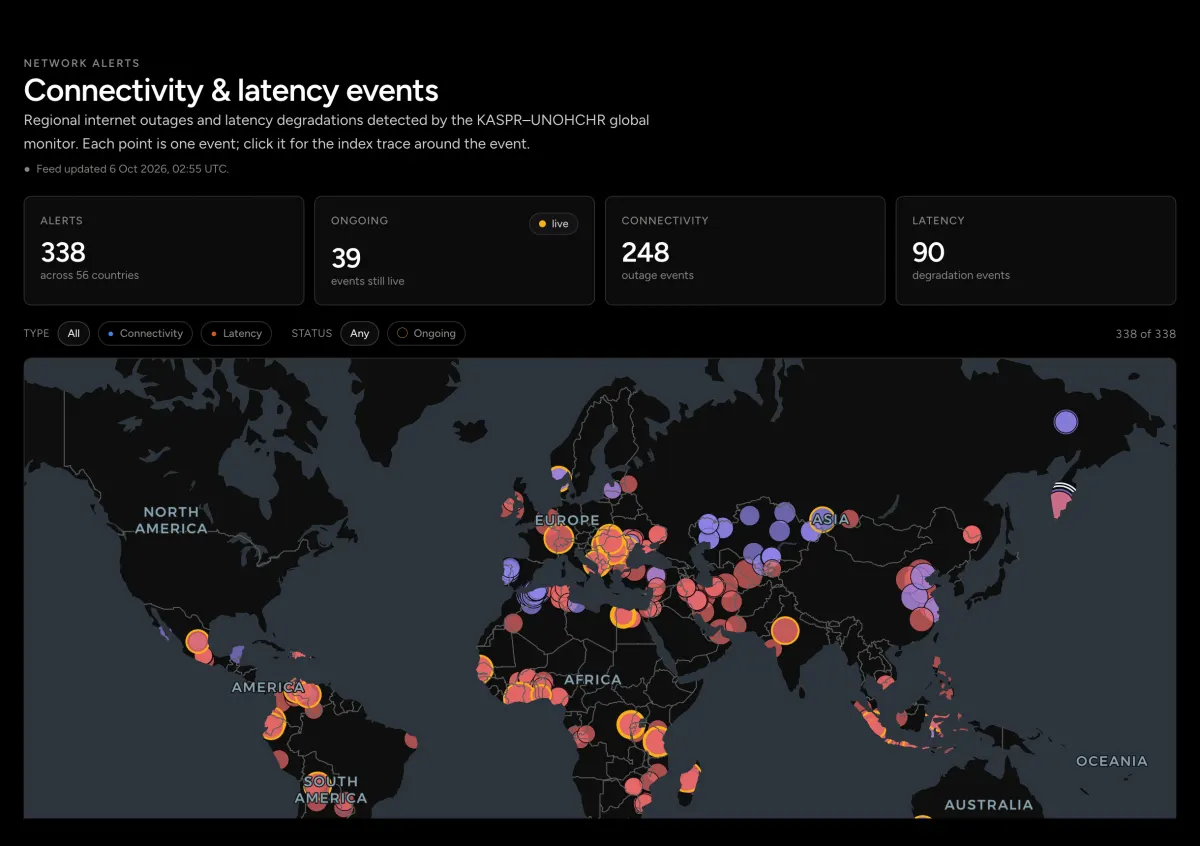
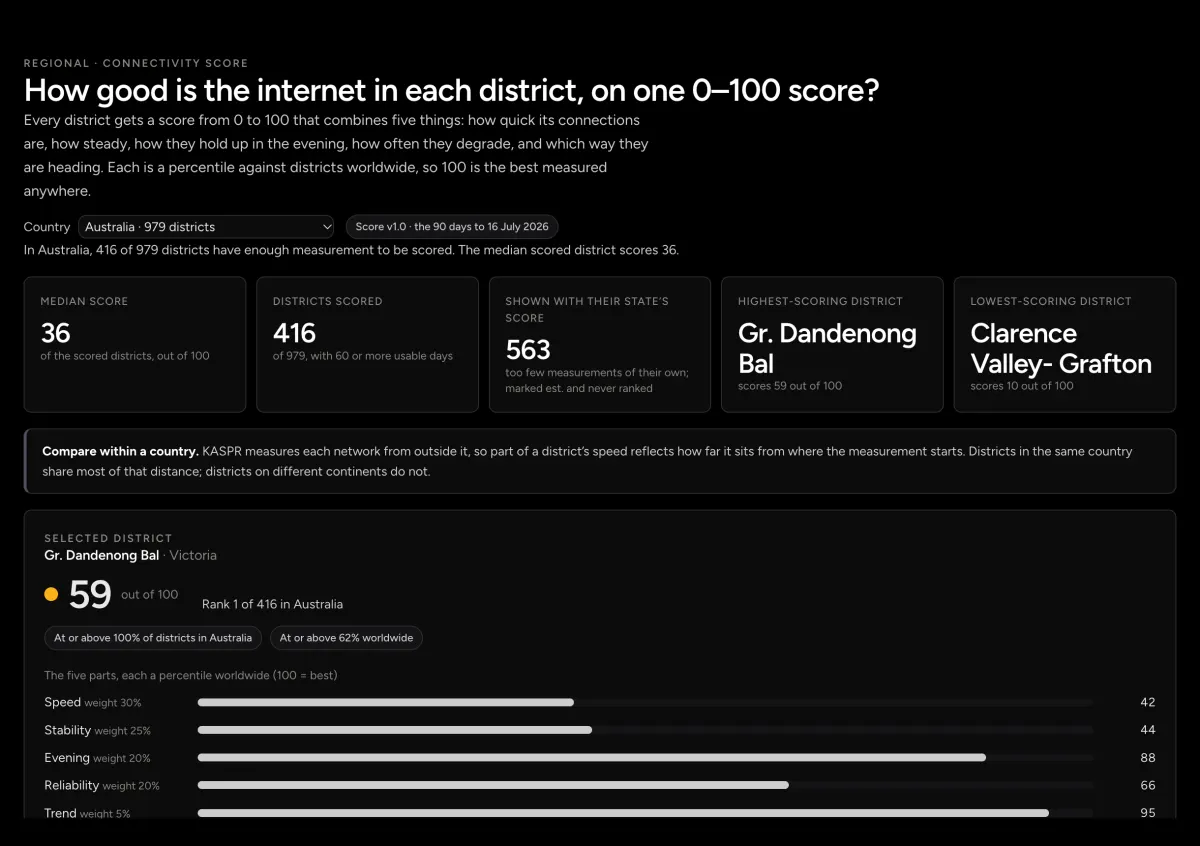
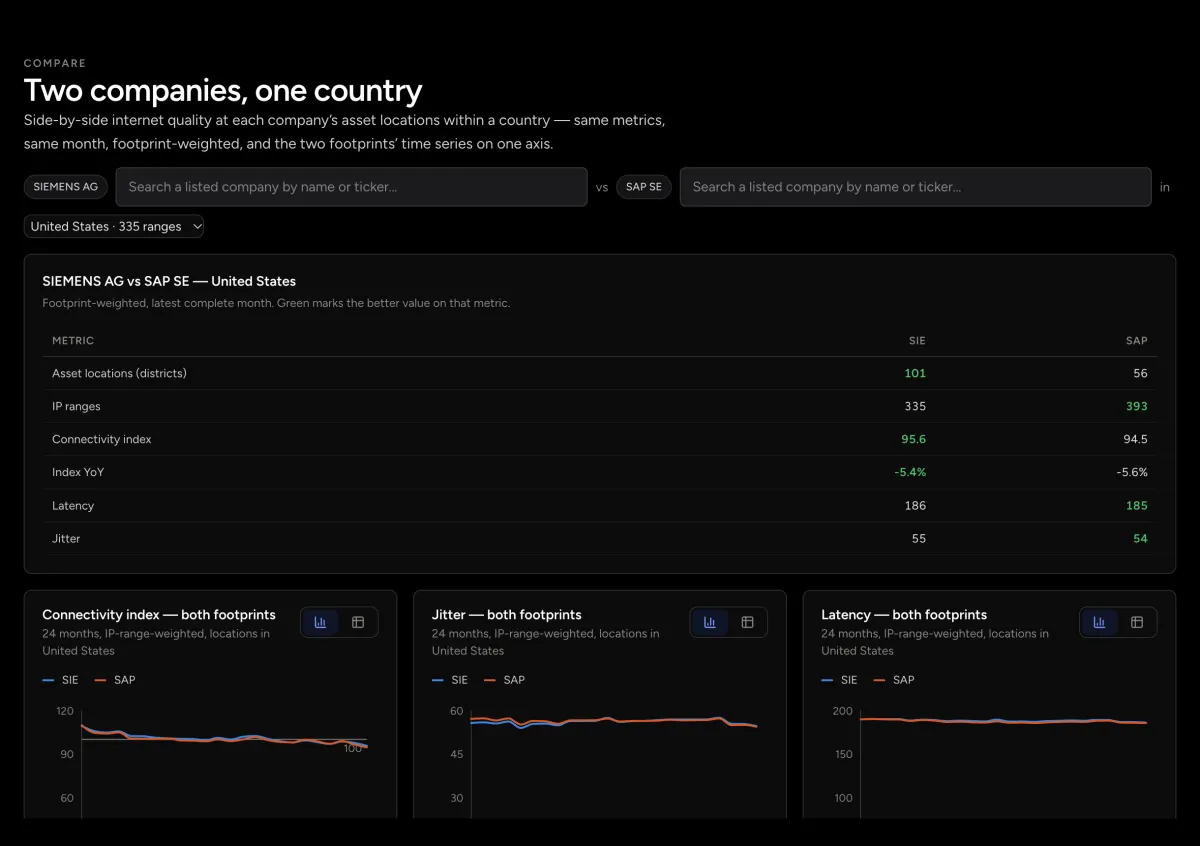
For more locations, more history or monitoring across whole countries, the KASPR dashboard opens the full record: every district on one map, anomaly events, company exposure, connectivity scores, side-by-side comparisons and more. Try it and explore the dashboard with free sample data.
Source: KASPR Datahaus (pulse.kasprdata.com) · Data to 16 Jul 2026 · The measurement records timing and depth, not cause.