
Company Intelligence · 13 November 2026
What the Microsoft 365 outage does not tell you about a company’s digital risk
Published 13 November 2026 · KASPR Datahaus
The regulators’ view
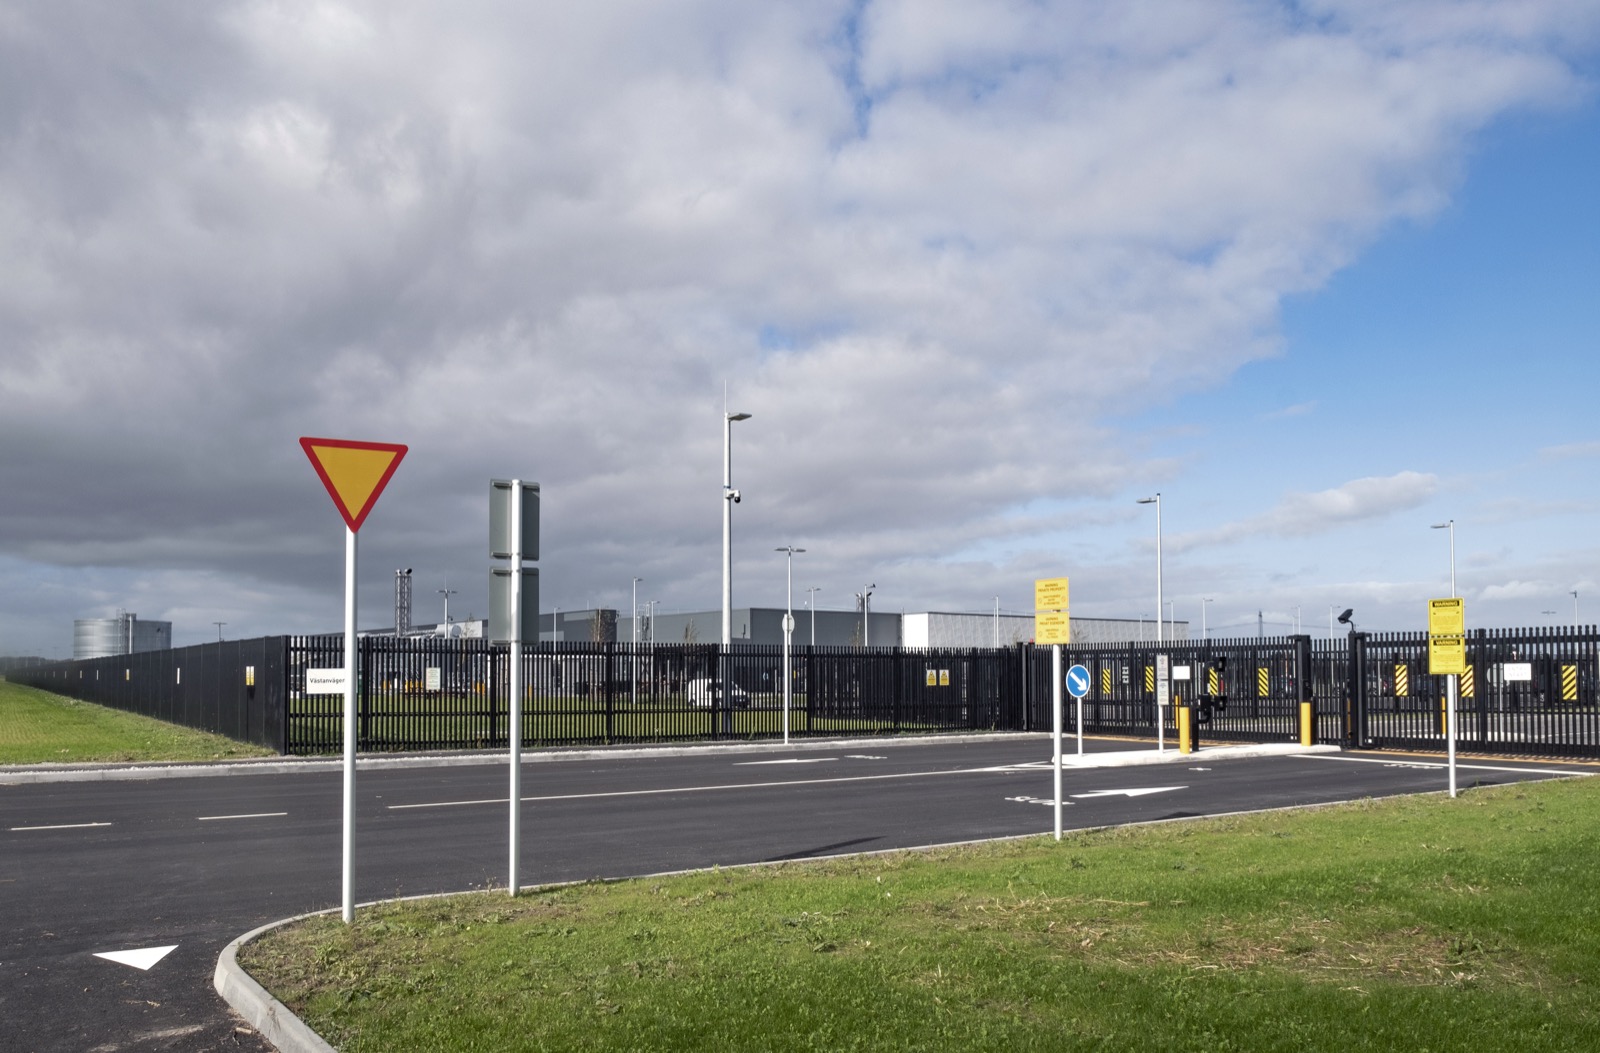
Regulators already treat this as operational risk
The EU’s Digital Operational Resilience Act (DORA) has applied since 17 January 2025.[5] It covers banks, insurers, investment firms and other financial entities. They have to manage their technology risk, report major incidents, test their resilience and keep a register of the technology providers they depend on. In November 2025 the European supervisory authorities named 19 technology providers as critical to the financial sector, Microsoft among them, and put them under direct oversight.[6]
DORA applies to financial firms and is mostly concerned with their software and cloud suppliers. The idea behind it applies more widely. Dependence on digital infrastructure is an operational risk, and it should be measured and written down, the same way firms treat fire, flood or supplier failure.
The layer underneath the cloud
Every cloud service is reached from a physical place
Every cloud service is reached over the internet from a physical place: an office, a plant, a warehouse, a branch. If the internet in that district is slow, unstable or down, it makes no difference whether Microsoft’s servers are healthy.
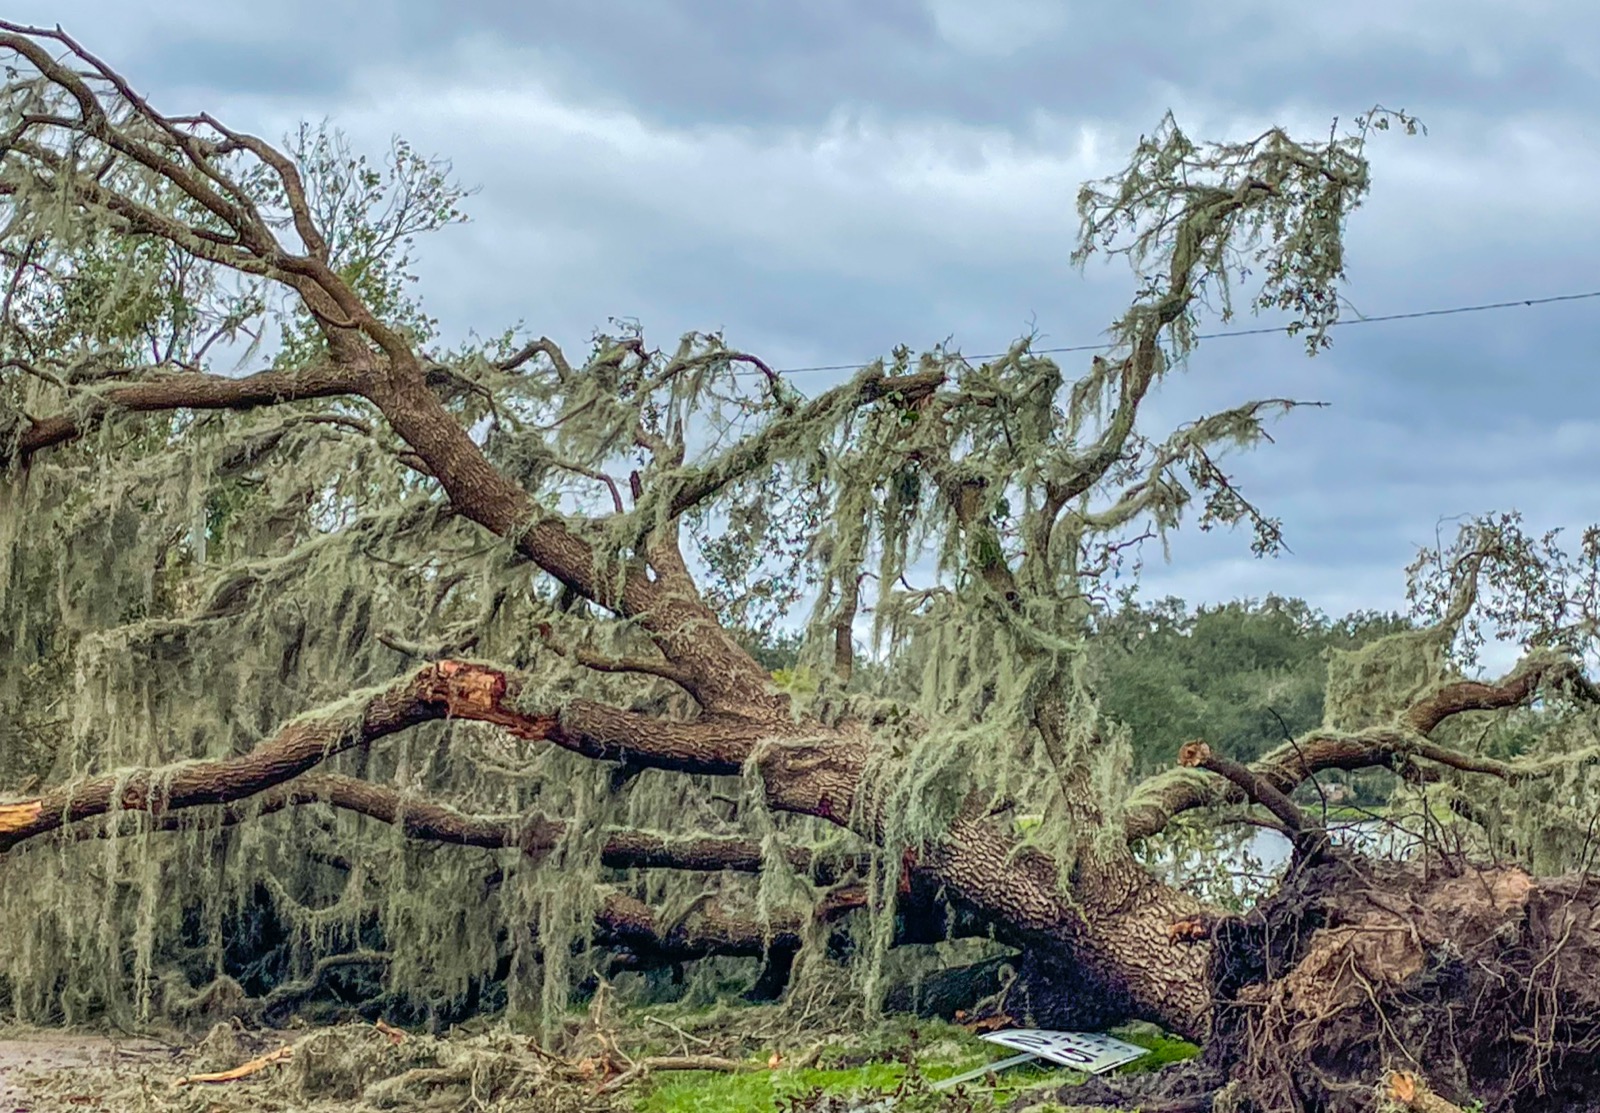
These local failures get far less coverage than a global cloud outage. A cable is cut. The power fails. A storm or flood takes out equipment. A government orders a shutdown. A network is congested every evening. They are also unevenly spread. Some districts go years without a serious episode and others have several a year. So a company’s exposure depends on where its sites are.
This is the part that is rarely measured. A vendor list shows which cloud a company uses. It does not show how reliable the internet is in the several hundred districts where a large company may operate.
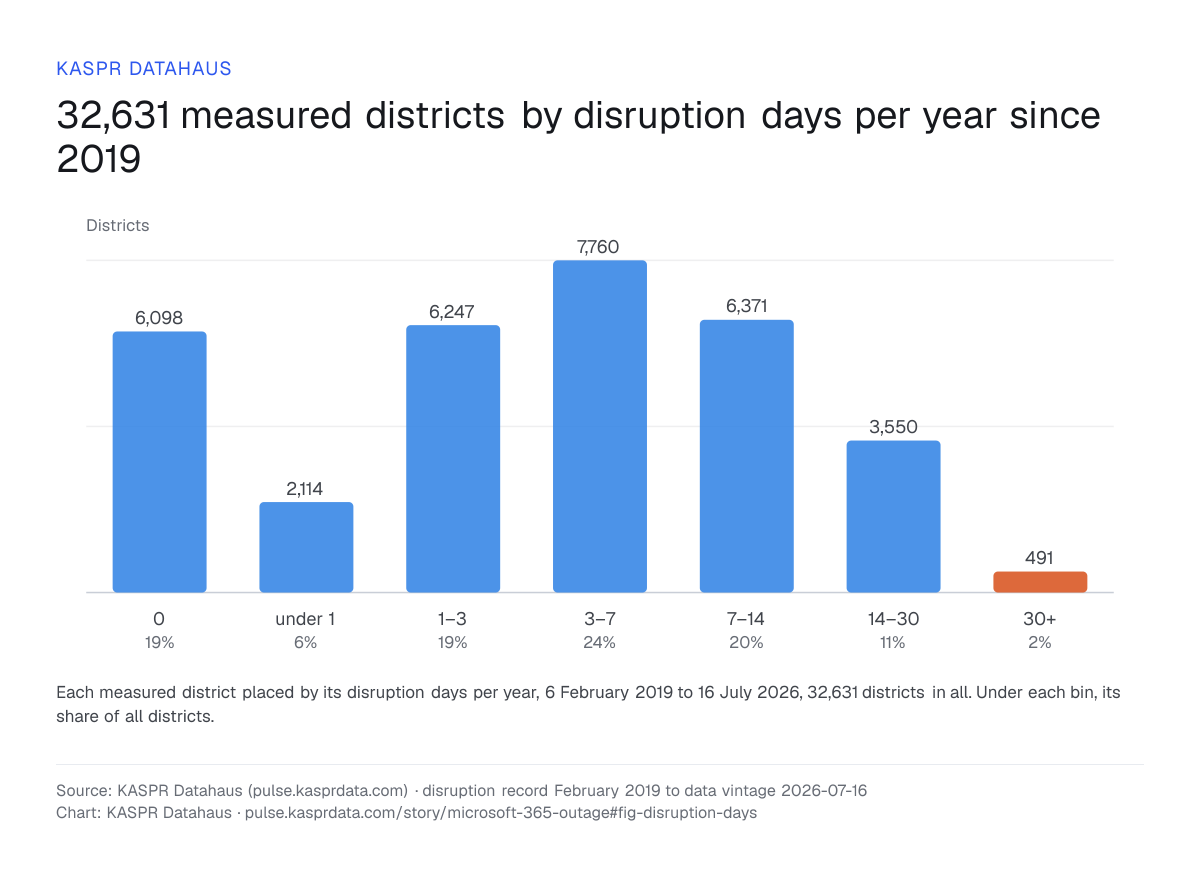
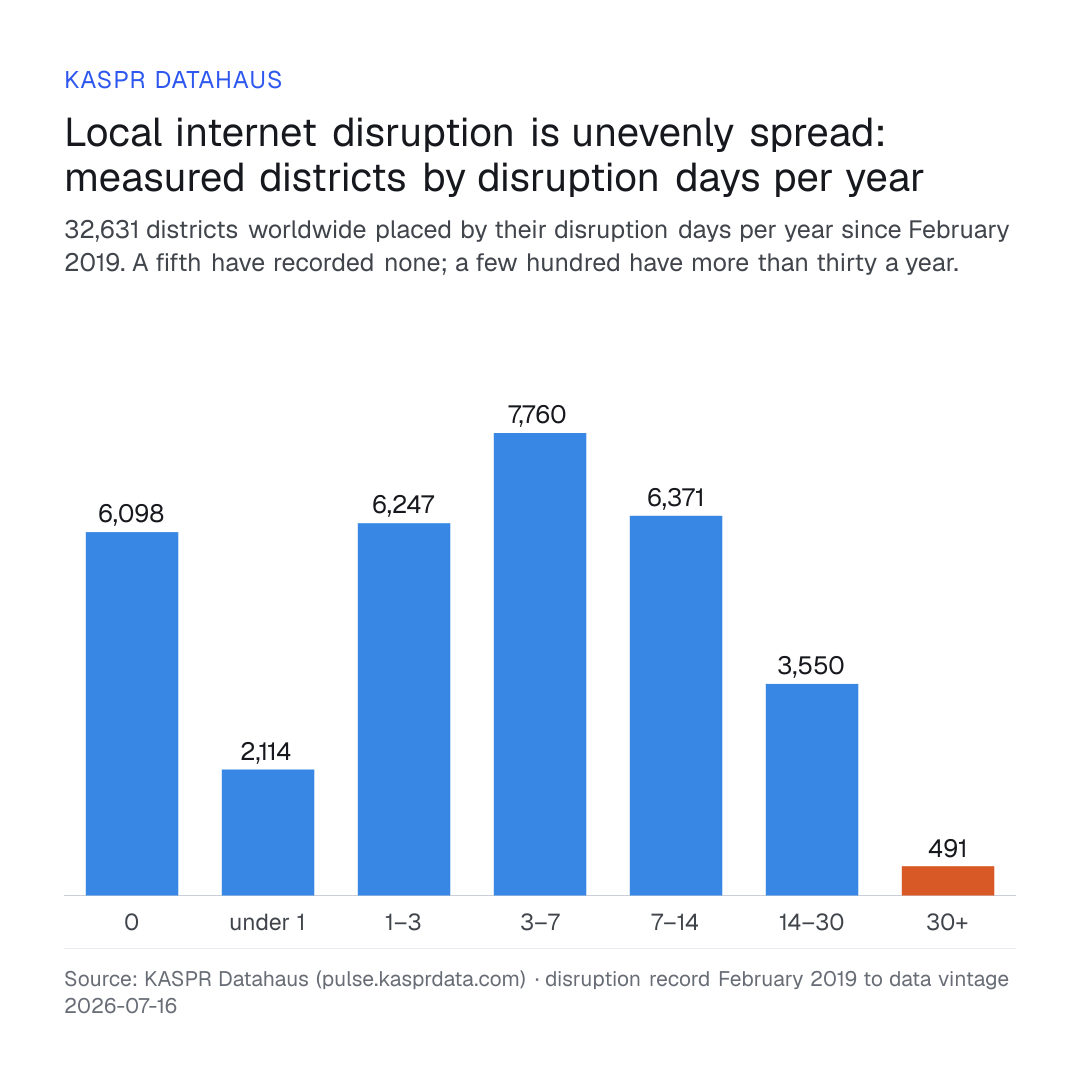
KASPR’s record covers 32,631 districts worldwide, measured the same way every hour since 6 February 2019. A disruption day is a day inside an episode in which the share of addresses answering in the district fell well below the district’s own normal. 6,098 districts, 19% of them, have recorded no episode at all. The median district has 3.8 disruption days a year, one in ten has more than 15.6, and 491 districts, 1.5%, have more than 30.
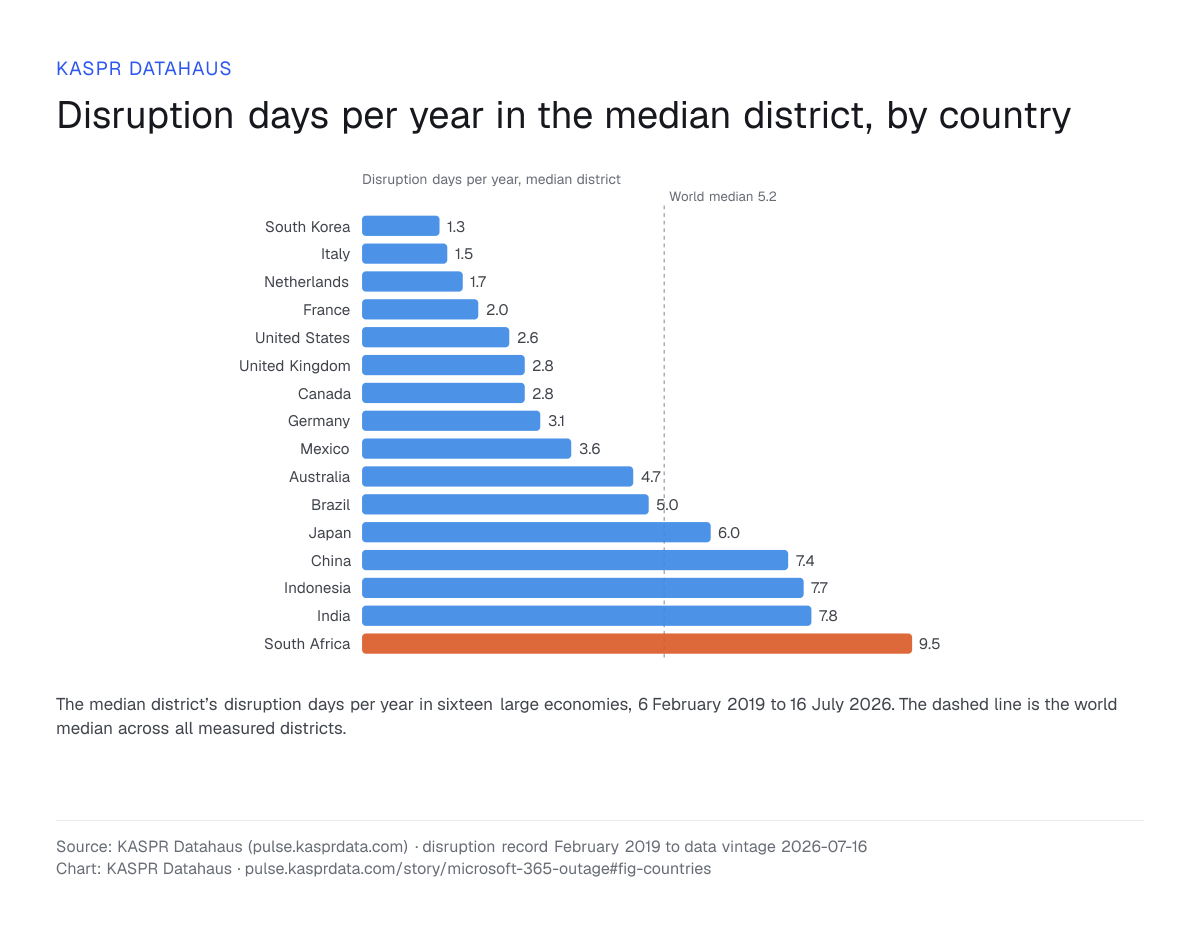
The same measure by country. In South Korea the median district records 1.3 disruption days a year, in South Africa 9.5, 7.1 times as many. The United States sits at 2.6 and the world median at 5.2. The chart shows the median district; within every one of these countries the range from the steadiest district to the roughest is wider than the range between countries.
What we measure
The internet record of the places where a company’s assets sit
KASPR Datahaus has measured the internet from the outside since February 2019. Every hour we send small round-trip requests to addresses in districts around the world and record whether they respond, how long the reply takes and how much that delay varies.
Our Company Intelligence reports connect those measurements to listed companies. We use public internet address registrations that name a company or its subsidiaries to find the districts where its address space sits. The report then gives the internet record of those districts:
- typical latency and jitter, and how they compare with the rest of the world
- connectivity compared with each district’s own normal level
- two years of monthly figures
- disruption history back to 2019: disruption days per site per year, the chance of an episode in a given quarter, the worst twelve months and the longest episode
- episodes that coincide with natural disasters
What the reports do not cover
It is just as important to say what the reports do not cover. We measure the internet in the places where a company’s assets are located, not the company’s own network, its data centres, its cloud providers or its software. Thursday’s outage is not the kind of event our data captures. Our records show when connectivity in a place dropped and by how much. They do not show why.
Who this is for
Insurers, investors and the teams who sign off on resilience
Insurers
Insurers writing cyber or business interruption cover need a view of exposure that does not depend on the policyholder’s own questionnaire. They also need to know which of their insured companies sit in the same weak districts, because those losses arrive together.
Investors
Investors can compare operational exposure across a portfolio on one consistent measure, with enough history to test it against past events.
Risk and audit teams
Risk and audit teams get independent evidence, collected from outside the company, for site resilience reviews and for assessing suppliers.
You can look up any listed company by name, ticker or ISIN at pulse.kasprdata.com/companies. The page shows what a report contains, and you can request a sample.
Sources
- CNBC, “Widespread Microsoft outage takes down Outlook and other 365 services”, 12 November 2026.
- ABC News, live coverage of the Microsoft outage, 13 November 2026.
- Microsoft 365 Status on X, 12 November 2026.
- SecurityWeek, “Microsoft 365 outage disrupts Outlook, Exchange Online and Teams”.
- Regulation (EU) 2022/2554 on digital operational resilience for the financial sector (DORA).
- European Banking Authority, “European Supervisory Authorities designate critical ICT third-party providers under DORA”, November 2025.
Further reading
- Al Jazeera, “Microsoft outage hits tens of thousands of users”, 12 November 2026.
- TechRadar, live coverage of the Outlook outage, November 2026.
- DLA Piper, “Application of the Digital Operational Resilience Act (DORA)”, February 2025.
- FStech, “EU names 19 critical tech providers under DORA, including AWS, Google and Microsoft”.
Charts: KASPR Datahaus, Location Intelligence store, data vintage 2026-07-16. Photos are credited under each one.
Questions and answers
- Does KASPR’s data show the Microsoft 365 outage of 12 November 2026?
- No. KASPR measures the internet in the places where a company’s assets are located, not the company’s own network, data centres, cloud providers or software. A failure inside Microsoft’s service is not the kind of event the record captures. The record shows when connectivity in a district dropped and by how much, not why.
- What does a KASPR Company Intelligence report measure?
- The internet record of the districts where a listed company’s address space sits, found from public address registrations that name the company or its subsidiaries. For those districts it gives typical latency and jitter against the rest of the world, connectivity against each district’s own normal, two years of monthly figures, disruption history back to 2019 and episodes that coincide with natural disasters.
- How unevenly is local internet disruption spread across the world’s districts?
- Across 32,631 measured districts, 6,098 (19%) have recorded no disruption episode since 6 February 2019. The median district has 3.8 disruption days a year, one in ten has more than 15.6, and 491 districts have more than 30. The figures run to data vintage 2026-07-16.
- Which countries’ districts record the most disruption days a year?
- Among sixteen large economies, the median district in South Africa records 9.5 disruption days a year and the median district in South Korea 1.3. The United States sits at 2.6, against a world median of 5.2. Within every country the spread between districts is wider than the spread between countries.
- Why does the EU’s DORA regulation matter for a company outside finance?
- DORA requires banks, insurers and investment firms in the EU to manage technology risk, report major incidents, test resilience and keep a register of the technology providers they depend on, and since November 2025 it places 19 critical providers, Microsoft among them, under direct oversight. The idea applies more widely. Dependence on digital infrastructure is an operational risk that should be measured and written down, like fire, flood or supplier failure.